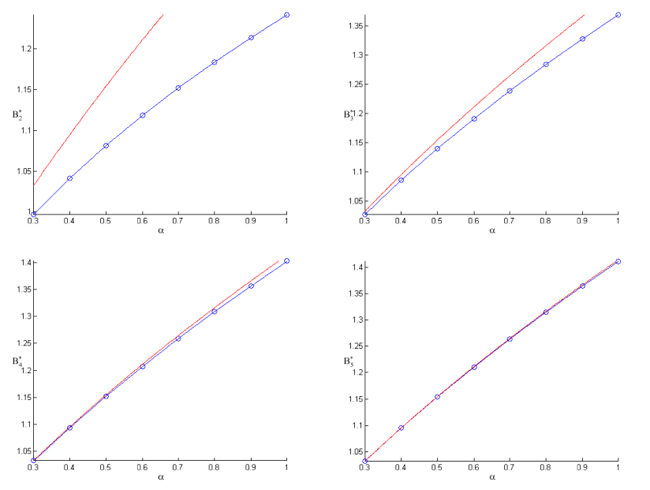
vs α for α ≥ 0.3 and γ = 1. The top left graph shows n = 2, the top right graph shows n = 3, the bottom left graph shows n = 4, and the bottom right graph shows n = 5.
vs α for α ≥ 0.3 and γ = 1. The top left graph shows n = 2, the top right graph shows n = 3, the bottom left graph shows n = 4, and the bottom right graph shows n = 5.
vs α for α ≥ 0.3 and γ = 1. The top left graph shows n = 2, the top right graph shows n = 3, the bottom left graph shows n = 4, and the bottom right graph shows n = 5.