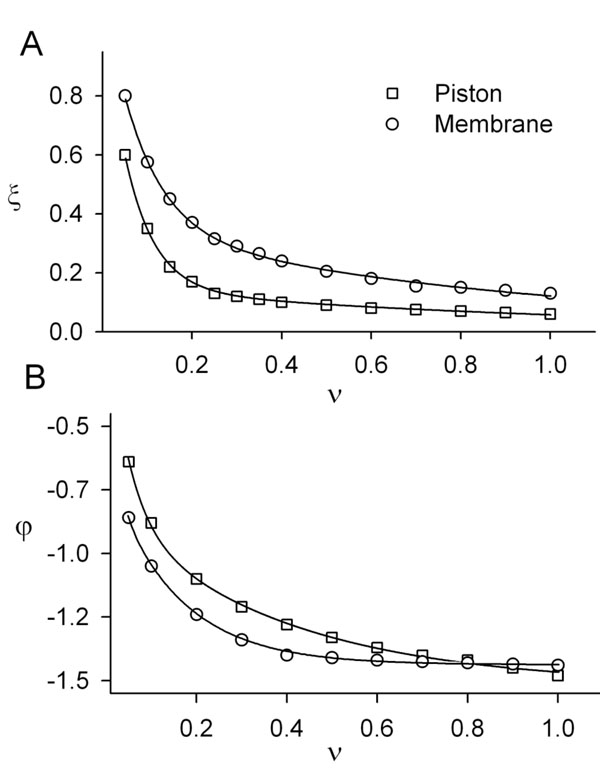
Fig. (4) Model response to sinusoidal stimuli. In A and B, graphs of the amplitude (ξ) and phase (φ) versus frequency for both the piston (squares) and the membrane (circles) models of the cupula. In both cases the graphs are very similar indicating that both models are qualitatively equivalent for the stimulus frequencies < 1 Hz.