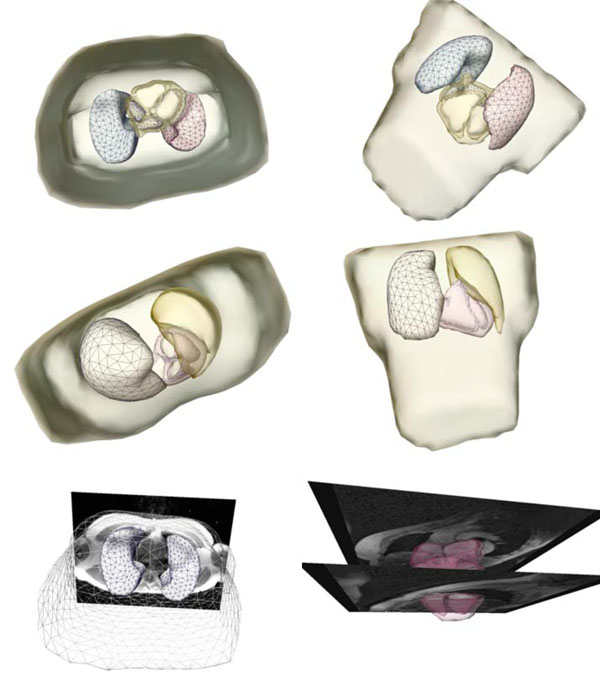
Fig. (2)
Extracted and triangulated patient-specific volume conductor model in different perspectives. The figures in the last row show the model superimposed onto the MRI volume data.