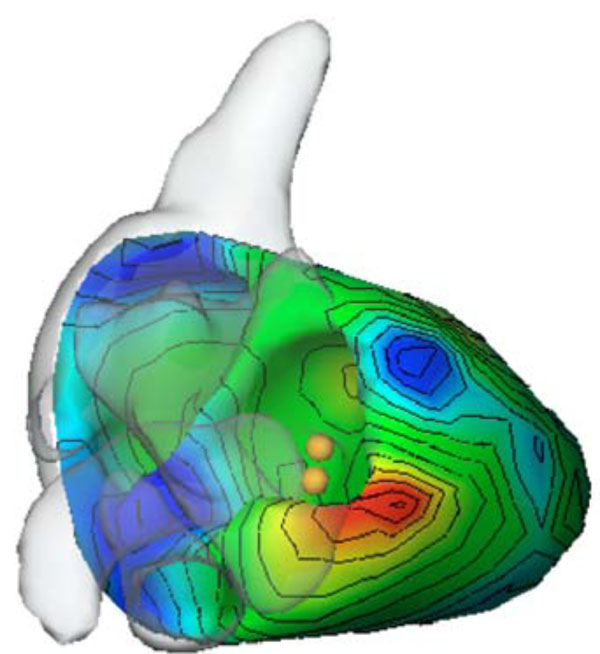
Fig. (7) Result of an activation time estimation. The cardiac model is shown in a cranial view. The accessory pathway that caused the WPW syndrome is colored red at a left lateral position. The two spheres mark the position where the cardiologist successfully ablated the accessory pathway using the CARTO™ system.