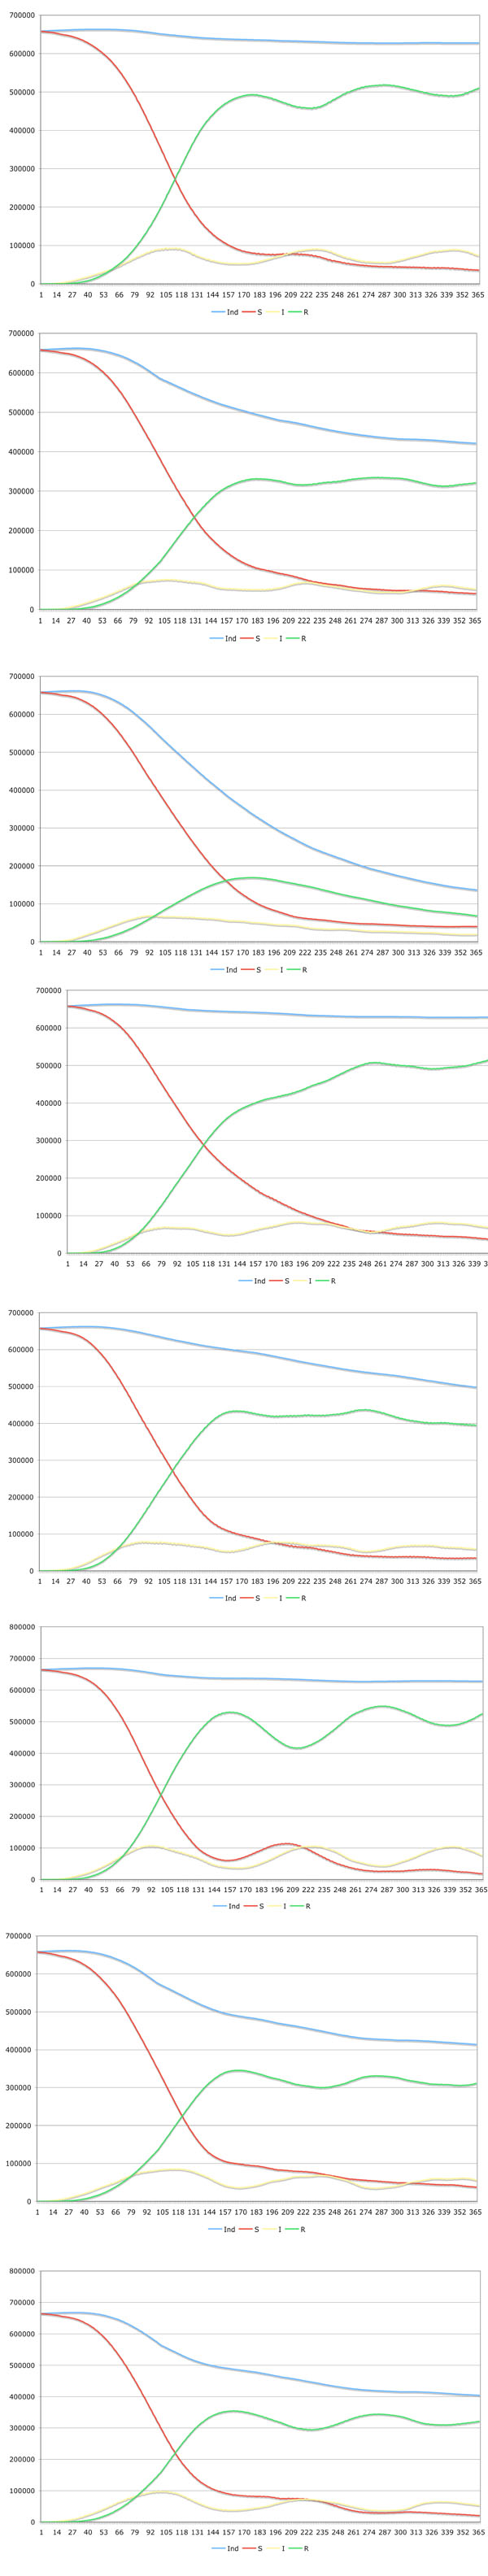
Fig. (2) The scenarios A-F and An, Bn are listed from the left upper to the right lower graphic. The blue color (Ind) is used for the population, red color (S) depicts the susceptible individuals, yellow (I) is used to visualize the infected individuals and the green color (R) was taken to depict the removed or temporarily immune individuals. For more information see text.