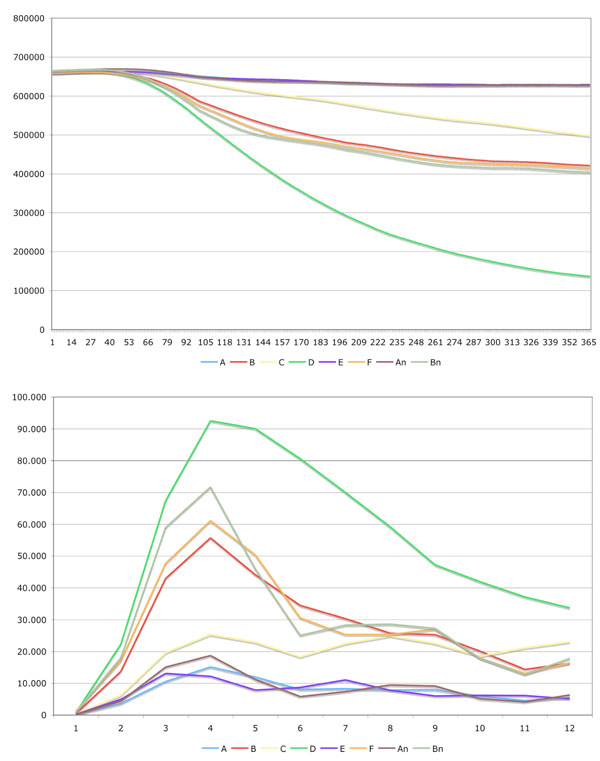
Fig. (3)
In the left image the changes in population over the time are depicted. The right image shows the death cases caused by the communicable disease aggregated per month.