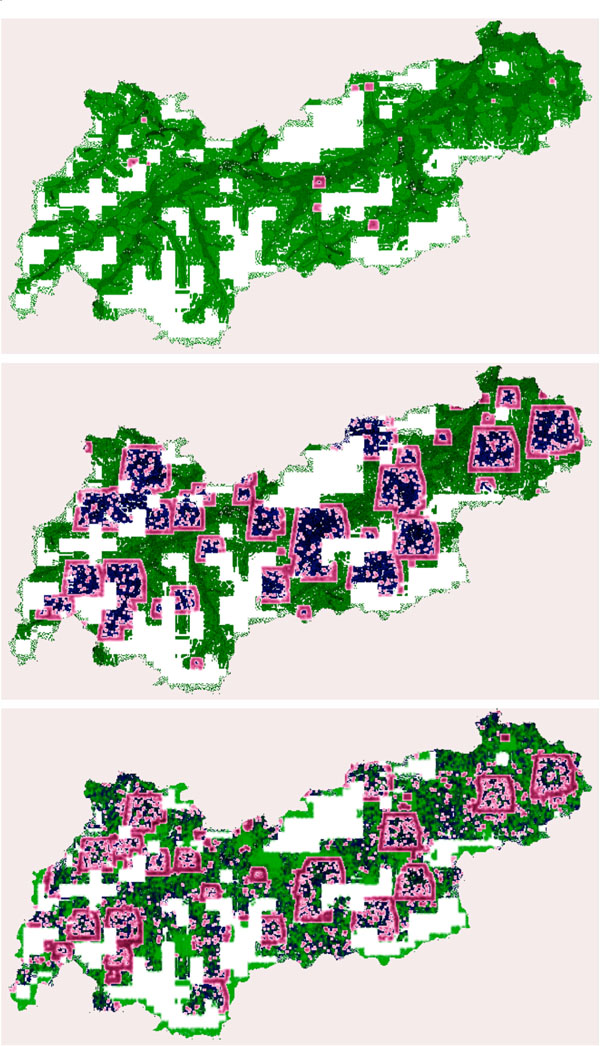
Fig. (4) The colors were used as following: green describes individuals in the state susceptible (S), gentle-pink marks individuals as in state infective (I) and dark blue marks the individuals as to be in state recovered (R). The first graphic depicts the simulation after 20 days. Although the simulation has started in the capital of Tyrol, in Innsbruck, after 20 days there are some outbreaks in the west of the state as well as in the east, which results form the fact that individuals are moving from cell to cell. Furthermore, unknown activities, which are denoted as spontaneous infection, are responsible for these characteristics. The second image shows a snapshot 80 days later at the time point 100 days after the infection started. It is clearly visible that in the capital where the disease spread started most people are in state recovered. Individual who did not die from the disease do have a temporary immunity. More than 50% of the individuals are in state infected. The last image shows a snapshot at time point 200 days after outbreak where individuals may get infected again. This represents the second outbreak wave with smaller amplitude.