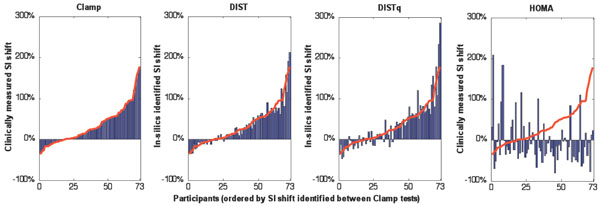
Fig. (7) The SI shift measured in-silico by the DIST and DISTq methods compared to the clinically measured euglycaemic clamp and HOMA derived SI shift. The SI values are sorted increasing from left to right by the SI shift observed between euglycaemic clamp tests. The red line shows the clamp derived SI shift overlaid on the results from the other tests.