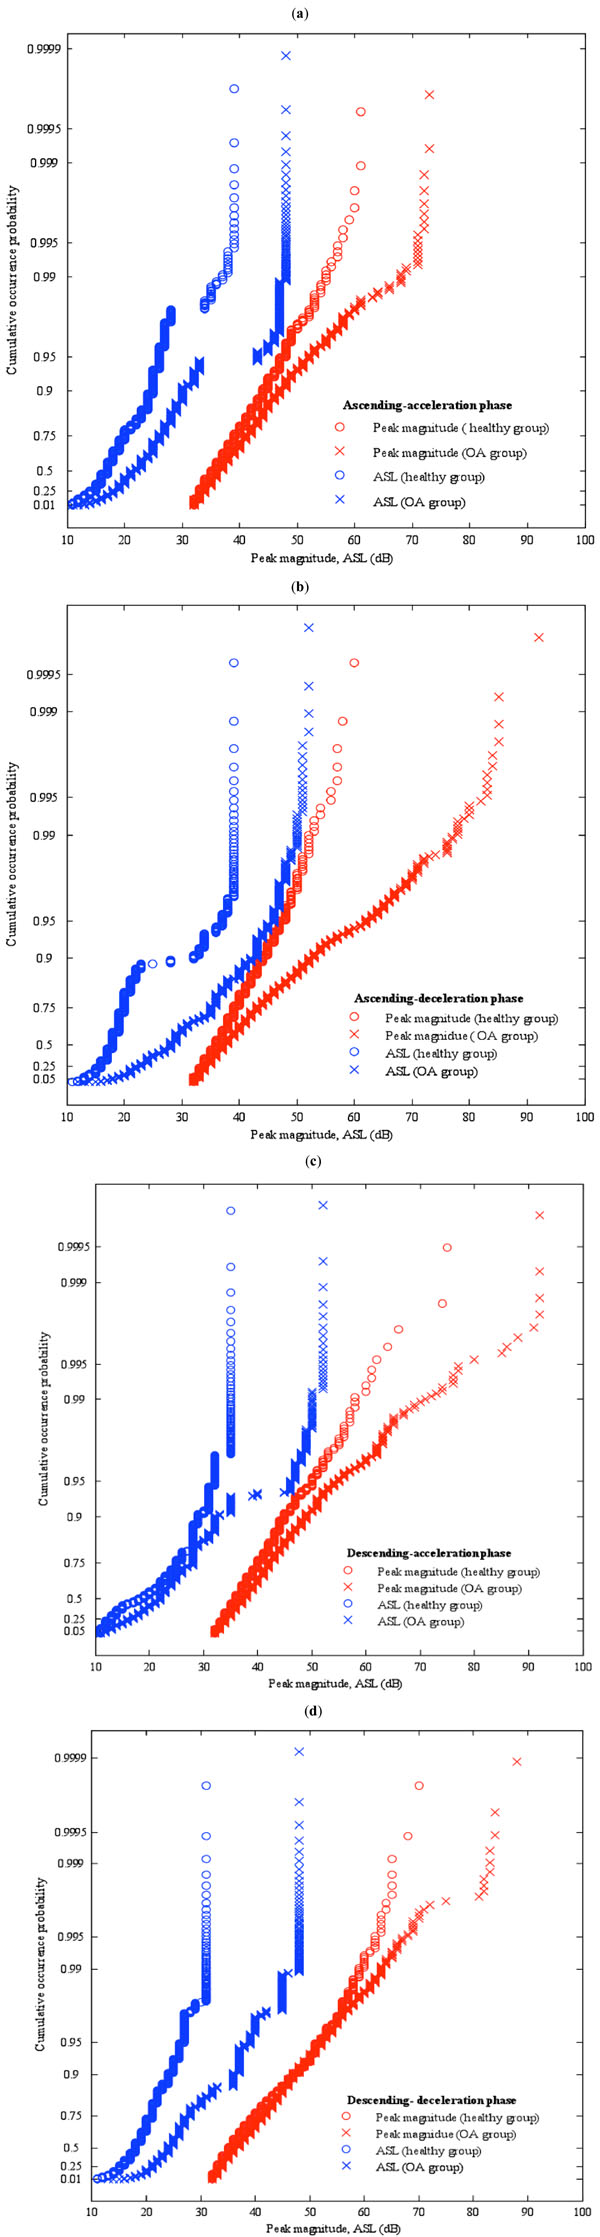
Fig. (4)
Exponential probability plots of peak magnitude and ASL for (a) AA phase, (b) AD phase, (c) DA phase, and (d) DD phase.