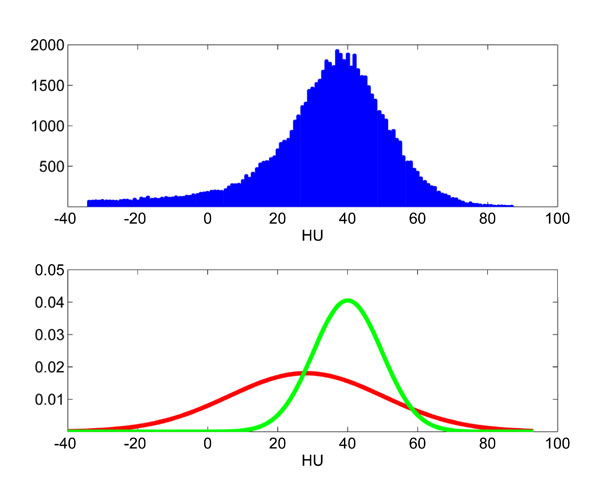
Fig. (5)
Intensity distribution of the non-fat region from Fig. (
4b
) and plot of the two Gaussian distributions from the estimated GMM.