- Home
- About Journals
-
Information for Authors/ReviewersEditorial Policies
Publication Fee
Publication Cycle - Process Flowchart
Online Manuscript Submission and Tracking System
Publishing Ethics and Rectitude
Authorship
Author Benefits
Reviewer Guidelines
Guest Editor Guidelines
Peer Review Workflow
Quick Track Option
Copyediting Services
Bentham Open Membership
Bentham Open Advisory Board
Archiving Policies
Fabricating and Stating False Information
Post Publication Discussions and Corrections
Editorial Management
Advertise With Us
Funding Agencies
Rate List
Kudos
General FAQs
Special Fee Waivers and Discounts
- Contact
- Help
- About Us
- Search


The Open Medical Informatics Journal
(Discontinued)
ISSN: 1874-4311 ― Volume 13, 2019
The Identification of Insulin Saturation Effects During the Dynamic Insulin Sensitivity Test
Paul D Docherty 1, J. Geoffrey Chase 1, Christopher E. Hann *, 1, Thomas F. Lotz1, J. Lin1, Kirsten A. McAuley 2, Geoffrey M. Shaw 3
Abstract
Background:
Many insulin sensitivity (SI) tests identify a sensitivity metric that is proportional to the total available insulin and measured glucose disposal despite general acceptance that insulin action is saturable. Accounting for insulin action saturation may aid inter-participant and/or inter-test comparisons of insulin efficiency, and model-based glycaemic regulation.
Method:
Eighteen subjects participated in 46 dynamic insulin sensitivity tests (DIST, low-dose 40-50 minute insulin-modified IVGTT). The data was used to identify and compare SI metrics from three models: a proportional model (SIL), a saturable model (SIS and Q50) and a model similar to the Minimal Model (SG and SIG). The three models are compared using inter-trial parameter repeatability, and fit to data.
Results:
The single variable proportional model produced the metric with least intra-subject variation: 13.8% vs 40.1%/55.6%, (SIS/I50) for the saturable model and 15.8%/88.2% (SIG/SG) for the third model. The average plasma insulin concentration at half maximum action (I50) was 139.3 mU·L-1, which is comparable to studies which use more robust stepped EIC protocols.
Conclusions:
The saturation model and method presented enables a reasonable estimation of an overall patient-specific saturation threshold, which is a unique result for a test of such low dose and duration. The detection of previously published population trends and significant bias above noise suggests that the model and method successfully detects actual saturation signals. Furthermore, the saturation model allowed closer fits to the clinical data than the other models, and the saturation parameter showed a moderate distinction between NGT and IFG-T2DM subgroups. However, the proposed model did not provide metrics of sufficient resolution to enable confidence in the method for either SI metric comparisons across dynamic tests or for glycamic control.
Article Information
Identifiers and Pagination:
Year: 2010Volume: 4
First Page: 141
Last Page: 148
Publisher Id: TOMINFOJ-4-141
DOI: 10.2174/1874431101004010141
Article History:
Received Date: 19/03/2010Revision Received Date: 15/04/2010
Acceptance Date: 13/05/2010
Electronic publication date: 27/7/2010
Collection year: 2010
open-access license: This is an open access article licensed under the terms of the Creative Commons Attribution Non-Commercial License (http://creativecommons.org/licenses/by-nc/3.0/) which permits unrestricted, non-commercial use, distribution and reproduction in any medium, provided the work is properly cited.
* Address correspondence to this author at the Centre for Bio-Engineering, University of Canterbury, Christchurch, New Zealand; Tel: +64 3 364 2987, Ext. 7348; E-mail: chris.hann@canterbury.ac.nz
| Open Peer Review Details | |||
|---|---|---|---|
| Manuscript submitted on 19-03-2010 |
Original Manuscript | The Identification of Insulin Saturation Effects During the Dynamic Insulin Sensitivity Test | |
INTRODUCTION
Although it is generally agreed that some saturable insulin action dynamics occur during most insulin sensitivity (SI) tests [1Black PR, Brooks DC, Bessey PQ, et al. Mechanisms of insulin resistance following injury Ann Surg 1982; 196(4): 420-35.-3Prigeon RL, Roder ME, Porte D Jr, et al. The effect of insulin dose on the measurement of insulin sensitivity by the minimal model technique. Evidence for saturable insulin transport in humans J Clin Invest 1996; 97(2): 501-7.], the identification of these effects is often crudely handled or ignored [4Ferrannini E, Mari A. How to measure insulin sensitivity J Hypertens 1998; 16(7): 895-906.]. This choice can be attributed to the assumption that saturation effects are not often encountered during the comparatively low insulin concentrations induced during frequently sampled intravenous insulin tolerance tests (FS-IVGTT). Similarly, in hyper-insulinaemic euglycaemic clamps (EIC) the very large insulin doses lead to saturation [2Natali A, Gastaldelli A, Camastra S, et al. Dose-response characteristics of insulin action on glucose metabolism: a non-steady-state approach Am J Physiol Endocrinol Metab 2000; 278(5): E794-801., 3Prigeon RL, Roder ME, Porte D Jr, et al. The effect of insulin dose on the measurement of insulin sensitivity by the minimal model technique. Evidence for saturable insulin transport in humans J Clin Invest 1996; 97(2): 501-7., 5Sowell M, Mukhopadhyay N, Cavazzoni P, et al. Evaluation of inuslin sensitivity in healthy volunteers treated with olanzapine, resperidone, or placebo: a prospective, randomised study using the two-step hyperinsulinemic, euglyemic clamp J Clin Endocrinol Metab 2003; 88(12): 5875-80., 6Kolterman OG, Insel I, Saekow M. Mechanisms of insulin resistance in human obesity: evidence for receptor and postreceptor defects J Clin Invest 1980; 65(6): 1272-84.] but saturation effects are still ignored, creating difficulty in comparing results across protocols or EIC insulin doses.
It is important to understand insulin action saturation effects when testing for SI, or when adjusting insulin therapy in glycaemic control [7Chase JG, Shaw GM, Le Compte AJ, et al. Implementation and evaluation of the SPRINT protocol for tight glycaemic control in critically ill patients: a clinical pratice change Crit Care 2008; 12(3): 156.-9Wong XW, Chase JG, Hann CE, et al. Development of clinical type 1 diabetes metabolic system model and in silico simulation tool J Diabetes Sci Technol 2008; 2(3): 424-35.]. Commonly used diagnostic tests that do not use a patient specific dosing protocol, such as the two-hour oral glucose tolerance test or dynamic insulin sensitivity test (DIST) [10Lotz T, Chase JG, McAuley KA, et al. Monte Carlo analysis of a new model-based method for insulin sensitivity testing Comput Methods Programs Biomed 2008; 89: 215-5.-12McAuley KA, Mann JI, Chase JG, et al. Point: HOMA - Satisfactory for the Time Being: HOMA: the best bet for the simple determination of insulin sensitivity, until something better comes along Diabetes Care 2007; 30(9): 2411-3.], may be affected, at least in some cases, by saturation. In particular, differing patient specific volumes of distribution will cause inter-subject variation in concentration for the same dose, and thus, the insulin efficiency may not be measured equally across subjects leading to greater error in these critical values. For example, successive stepped clamp tests with varying glucose or insulin concentrations have yielded significantly different outcome insulin sensitivity metrics for the same individual [5Sowell M, Mukhopadhyay N, Cavazzoni P, et al. Evaluation of inuslin sensitivity in healthy volunteers treated with olanzapine, resperidone, or placebo: a prospective, randomised study using the two-step hyperinsulinemic, euglyemic clamp J Clin Endocrinol Metab 2003; 88(12): 5875-80., 6Kolterman OG, Insel I, Saekow M. Mechanisms of insulin resistance in human obesity: evidence for receptor and postreceptor defects J Clin Invest 1980; 65(6): 1272-84.]. Glycaemic regulation may also be improved by understanding insulin saturation, as simple assumptions of unsaturated, proportional action may not be appropriate with very insulin resistant individuals [13Chase JG, Shaw GM, Lin J, et al. Impact of insulin-stimulated glucose removal saturation on dynamic modelling and control of hyperglycaemia Int J Intell Syst Technol Appl (IJISTA) 2004; 1(1/2): 79-94., 14Pielmeier U, Andreassen S, Nielsen BS, et al. A simulation model of insulin saturation and glucose balance for glycamic control in ICU patients Comput Methods Programs Biomed 2010; 97(3): 211-2.].
Fig. (1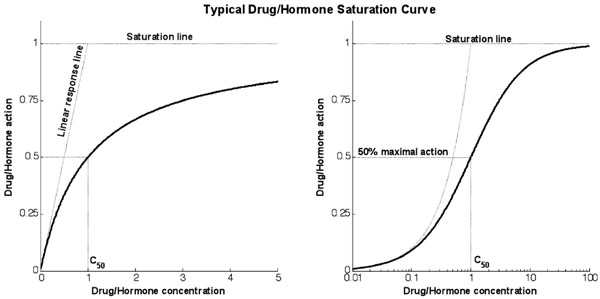 ) shows a typical response curve for the action of drugs or hormones as a function of concentration. The linear response line shows the gradient at the theoretical zero concentration point and measures the infinitesimal increase in action caused by an infinitesimal increase in concentration from zero. The saturation line shows the theoretical maximum action line. The action will asymptotically approach this line as concentration increases and significant saturation effects become apparent.
 |
Fig. (1) Typical response curve for any typical saturative drug or hormone. The graphs use proportional and logarithmic x-axis for the same response (linear gradient of 1 and saturation maximum of 1). |
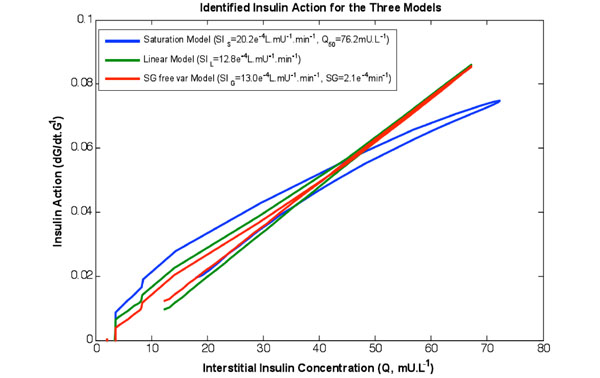 |
Fig. (2) The rate of change of available glucose as a function of the insulin concentration in the interstitium for the three models identified on the same data set. Note the curved shape of the saturation model captures the behaviour of Fig. (1 |
A typical EIC protocol with a single insulin infusion rate will define a single point on a subject-specific saturation curve. Although equivalence should be given to results along the same saturation curve, it is assumed that equivalence lies on a straight line between this point and the origin. Hence comparing EIC values from differing dosing regimens loses value. Models used during SI identification for dynamic tests frequently have linear insulin-dependent terms [11Lotz T. 'High resolution clinical model-based assessment of insulin sensitivity' (PhD Thesis).http://hdl.handle.net/10092/1571. Christchurch, New Zealand: University of Canterbury 2007., 15Bergman RN, Prager R, Volund A, et al. Equivalence of the insulin sensitivity index in man derived by the minimal model method and the euglycemic glucose clamp J Clin Invest 1987; 79(3): 790-800., 16Bergman RN, Ider YZ, Bowden CR, et al. Quantitative estimation of insulin sensitivity Am J Physiol 1979; 236(6): E667-77.]. Such terms could be represented as linear lines from the origin, with higher sensitivity represented with steeper gradients, and insulin action increasing with concentration with no diminishing returns.
To define saturation effects, the glucose disposal at a series of insulin concentrations must be observed. Previous studies into the saturation of insulin action have used either stepped or multiple EIC tests [2Natali A, Gastaldelli A, Camastra S, et al. Dose-response characteristics of insulin action on glucose metabolism: a non-steady-state approach Am J Physiol Endocrinol Metab 2000; 278(5): E794-801., 6Kolterman OG, Insel I, Saekow M. Mechanisms of insulin resistance in human obesity: evidence for receptor and postreceptor defects J Clin Invest 1980; 65(6): 1272-84., 17Laakso M, Edelman SV, Brechel G, et al. Decreased effect of inuslin to stimulate skeletal muscle blood flow in Obese man: A novel mechanism for insulin resistance J Clin Invest 1990; 85(6): 1844-52., 18Rizza RA, Mandarino LJ, Gerich JE. Dose-response characteristics for effects of insulin on production and utilization of glucose in man Am J Physiol 1981; 240(6): E630-9.]. The stepped EIC is a long protocol wherein the insulin infusion rate is sequentially changed in a stepwise fashion, usually at 2 hourly intervals for 6-8 hours clamping patients at each steady-state plasma insulin concentration. Studies that used multiple tests have required subjects to have multiple EIC tests on separate days with differing insulin infusion rates. In both cases, increasing insulin doses resulted in decreasing estimates of SI for a given subject.
This article presents a method for the identification of a patient-specific insulin concentration at half maximal action (I50) and the theoretical zero insulin gradient (SIS) of glucose disposal (as a function of glucose availability). Contrary to previously presented studies, the saturation parameters will be identified using a single dynamic test. Hence, the method presented, if successful, offers the advantages of both reduced testing and reduced (single) test intensity to determine an important patient-specific value.
METHOD
Participants
Participants were recruited under informed consent from the Canterbury and Otago regions of New Zealand to take part in the pilot study of the DIST test [10Lotz T, Chase JG, McAuley KA, et al. Monte Carlo analysis of a new model-based method for insulin sensitivity testing Comput Methods Programs Biomed 2008; 89: 215-5., 11Lotz T. 'High resolution clinical model-based assessment of insulin sensitivity' (PhD Thesis).http://hdl.handle.net/10092/1571. Christchurch, New Zealand: University of Canterbury 2007.]. Participant demographics are detailed in Lotz [11Lotz T. 'High resolution clinical model-based assessment of insulin sensitivity' (PhD Thesis).http://hdl.handle.net/10092/1571. Christchurch, New Zealand: University of Canterbury 2007.]. A total of 18 participants were recruited who represented a range of physiological conditions (age, fitness level and diabetic state) and 46 DIST trials were completed. Study approval was obtained from the Upper South A Regional Ethics Committee for this study.
DIST Test Protocol
Participants reported to the place of testing in the morning after an overnight fast. All participants signed informed consent prior to their first test. A cannula was placed in the ante-cubital fossa from which blood was sampled at t = 0, 10, 15, 20, 25, 30, 35, 40 and 50 minutes and boluses of glucose (50% dextrose) and insulin (actrapid) were administered after the t = 10 and 20 minute samples respectively. Testing was completed as part of the pilot investigation of the DIST test so the dosing schedule was varied by design. Participants either received a low dose (5g glucose and 0.5U insulin), medium dose (10g -1U), or high dose (20g - 2U) test. Those participants that completed three tests repeated one of the doses. Table 1 summarises the 18 participant’s data and defines the NGT (individuals with normal glucose tolerance), and T2DM-IFG (individuals with type 2 diabetes or impaired fasting glucose) subgroups. Impaired glucose tolerance could not be diagnosed with the data available. However, impaired fasting glucose can be identified with the basal sample of the DIST data.

Summarised Participant Details, Further Information can be Seen in Lotz et al. [10Lotz T, Chase JG, McAuley KA, et al. Monte Carlo analysis of a new model-based method for insulin sensitivity testing Comput Methods Programs Biomed 2008; 89: 215-5.]


Physiological Model
A pharmaco-kinetic/pharmaco-dynamic model is used to identify patient-specific parameters from the test data. Equations 1-5 are used to identify a proportional SI, as determined by Lotz et al. [10Lotz T, Chase JG, McAuley KA, et al. Monte Carlo analysis of a new model-based method for insulin sensitivity testing Comput Methods Programs Biomed 2008; 89: 215-5., 11Lotz T. 'High resolution clinical model-based assessment of insulin sensitivity' (PhD Thesis).http://hdl.handle.net/10092/1571. Christchurch, New Zealand: University of Canterbury 2007.].
Glucose-Insulin Pharmaco-Dynamics
where: k1, k2, k3, nK, nL, nI, and nC are rate parameters (min-1 or L·min-1); αI is the saturation coefficient of liver clearance (L·mU-1); C and Y are plasma and interstitial compartment C-peptide concentrations (pmol·L-1); Uen(t) is the rate of endogenous insulin and (equi-molar) C-peptide production (mU·min-1·L-1); ξ is a conversion factor (6.94pmol/mU); I and Q are plasma and interstitial compartment insulin concentrations (mU·L-1); Uex and P are the insulin and glucose bolus inputs (mU and mmol); Vp and Vq are volumes of distribution (L); xL is the fractional first pass liver extraction (%); G is the glucose concentration in the plasma (mmol·L-1); Gb and Qb are basal levels of the respective species; VgL is the volume of distribution of glucose (L); pgu is the non-insulin mediated glucose disposal rate (min-1); SIL is the proportional insulin sensitivity constant (L·mU-1·min-1) and the ‘b’ subscript denotes the basal concentration of the respective species.
To generate a saturation model, Equations 4 and 5 must be altered to incorporate appropriate terms. Equations 6 and 7 show how Equations 4 and 5 have been altered to define and include saturation. To enable a consistent treatment of the saturation characteristics of both the insulin absorption to the cell and resultant glucose disposal, the denominators in Equations 6 and 7 must be identical.
where:Q50 is the insulin concentration in the interstitium at half maximal glucose disposal rate (mU·L-1);VgSis the volume of distribution of glucose when the saturable parameters are identified and SIS is the gradient of the saturation curve at the theoretical zero insulin position (L·mU-1·min-1).
In addition to these models, the saturable model will be evaluated against a variation of the Minimal Model, which is frequently used for SI identification in similar tests [4Ferrannini E, Mari A. How to measure insulin sensitivity J Hypertens 1998; 16(7): 895-906., 15Bergman RN, Prager R, Volund A, et al. Equivalence of the insulin sensitivity index in man derived by the minimal model method and the euglycemic glucose clamp J Clin Invest 1987; 79(3): 790-800., 16Bergman RN, Ider YZ, Bowden CR, et al. Quantitative estimation of insulin sensitivity Am J Physiol 1979; 236(6): E667-77.]. Many model-based methods for determining SI, such as the Minimal Model, for dynamic tests utilise a glucose dependant disposal term (SG) as a free variable [16Bergman RN, Ider YZ, Bowden CR, et al. Quantitative estimation of insulin sensitivity Am J Physiol 1979; 236(6): E667-77.]. However, the Minimal Model typically does not model the insulin pharmaco-kinetics in a directly physiological way, particularly in the plasma. Hence, in this study, Equations 1-4 are used to provide the insulin pharmacokinetics for this model. This choice enables a more accurate and fair comparison of SI metrics identified from the pharmaco-dynamics modelled, since the kinetics are equivalent. Equation 8 is used to model the glucose pharmaco-dynamics for this last model, referred to as the SG free variable model, as it is not strictly the minimal model.
where:SG is the identified rate of glucose dependant glucose disposal (min-1); VgG is the volume of distribution of glucose when the SG free variable parameters are identified and SIG is the proportional SI metric derived when SG is identified as a variable (L·mU-1·min-1)
Identification Process
Insulin sensitivity (SI) metrics are identified for each test using the proportional approximation of Equation 5, the saturative expressions of Equations 6-7, and the SG free variable model of Equation 8. The first step toward identification of SI, is the deconvolution of the C-peptide data using Equations 1 and 2, and the parameters identified using the estimation process outlined in Van Cauter et al. [19Van Cauter E, Mestrez F, Sturis J, et al. Estimation of insulin secretion rates from C-peptide levels. Comparison of individual and standard kinetic parameters for C-peptide clearance Diabetes 1992; 41(3): 368-77.]. This step produces an endogenous insulin production profile (Uen) that is required for all three models presented.
The nL, xL, VgL and SIL metrics of the proportional model (Equations 3-5) are identified using the iterative integral method [20Hann CE, Chase JG, Lin J, et al. Integral-based parameter identification for long-term dynamic verification of a glucose-insulin system model Comput Methods Programs Biomed 2005; 77(3): 259-70., 21Docherty PD, Chase JG, Lotz T, et al. DISTq: An iterative analysis of glucose data for low-cost real-time and accurate estimation of insulin sensitivity Open Med Inform J 2009; 3: 65-76.]. Due to the very high resolution needed to accurately compare the metrics, the number of iterations is increased from 5 to 25. Each iteration of the integral method uses species concentration profiles that have been re-simulated using the parameters identified during the previous iteration. Integrating factors are used for re-simulations when the equations can be linearised (Equations 4, 5, 7 and 8), and quick converging Picard iterations are used other cases (Equations 3, 6) [22Kim C, Kim SB. Modelling contaminant transport in a three-phase groundwater system with the Freundlich-type retardation factor Environ Technol 2007; 28(2): 205-16., 23Youssef IK, El-Arabawy HA. Picard iteration algorithm combined with Gauss-Seidel technique for initial value problems Appl Math Comput 2007; 190(1): 345-55.]. Thus, highly accurate, patient-specific parameters (nL, xL, VgL and SIL) and insulin and glucose concentration re-simulations are identified for the proportional model.
The simple iterative integral method is not possible with the saturable variables of Equations 6 and 7 (SIS, Q50 and VgS), which are not mathematically separable. Thus, a one dimensional grid search method is used to identify the metrics that minimise the re-simulation 2-norm error to the measured insulin and glucose data. To ensure identification is targeted towards relevant concentrations, the reciprocal of Q50 (αQ, 1/Q50) is used. Six equally spaced αQ values are defined on a range between 0 and 0.5 (L·mU-1). The range of 0 to 0.5 represents a range of values from the proportional case (Q50=∞) to an unrealistically low saturation threshold (Q50=2 mU·L-1). Each value is then used in the iterative integral method to identify nL, xL, VgS and SIS. The αQ value that produces the lowest 2-norm error between insulin and glucose simulations and the measured clinical data is used as the centre point of a new search range. The new range is 40% the span of the previous range, but still bounded by 0 and 0.5. Eight such range reductions are iterated and an aQ value accurate to within 0.1% is identified.
To ensure an equivalent comparison of SI metrics, the SG free variable model uses the same pharmaco-kinetic model for insulin as the proportional model, and so the same nL and xL metrics and I(t) and Q(t) simulations are used to identify the sensitivity parameters. Equation 8 is separable in terms of the variables to be identified, and thus, the iterative integral method can be used. However, utilising both SG and SIG as free variables causes in-stability in identification [24Caumo A, Vicini P, Zachwieja JJ, et al. Undermodeling affects minimal model indexes: insights from a two-compartment model Am J Physiol 1999; 276(6 Pt 1): E1171-93., 25Pillonetto G, Sparacino G, Magni P, et al. Minimal model S(I)=0 problem in NIDDM subjects: nonzero Bayesian estimates with credible confidence intervals Am J Physiol Endocrinol Metab 2002; 282(3): E564-73.]. Thus, 100 iterations of the iterative integral method are used and the rates of convergence of the SG, SIs and Vg parameters are slowed and stabilised by averaging the identified value and the values of the previous three iterations, defined:
In Silico Verification of Identification Method
To ensure that the method for the identification of saturation parameters is, in fact, identifying meaningful coefficients, and not just fitting to noise, an in-silico analysis was completed. Five hundred virtual subjects were simulated with the following evenly distributed ranges: height 1.5-2.3 (m), BMI 18-36 (kg/m2) and age 18-60 (yrs). A random SI value (2.5-30e-4L.mU-1.min-1) was assigned to each virtual participant and which allowed the a-posteriori parameter estimation defined in [21Docherty PD, Chase JG, Lotz T, et al. DISTq: An iterative analysis of glucose data for low-cost real-time and accurate estimation of insulin sensitivity Open Med Inform J 2009; 3: 65-76.]. To mimic the in-accuracy of the a-posteriori parameter identification equations, the obtained values were randomised, (normally distributed with a CV of 33% bound between a half and double the original value). The identified a-priori and a-posteriori parameters with Equations 3-5 allow simulation of insulin, and glucose concentration responses to the DIST test stimulus. Virtual samples were taken from the simulated concentration responses at the times defined by the DIST protocol and represented a clean, noise and saturation-free data set.
Normally distributed noise was added to each clean data set in accordance with reported assay errors (glucose CV: intra 2% inter 1%, and insulin CV: intra 3% inter 2%). Each set was used to identify SI using Equations 3-5 and then again using Equations 3, 6 and 7 with Q50 fixed at 10000 mU.L-1 (using Equations 4-5 assumes no saturation threshold (Q50=∞)). The simulated glucose profiles were then compared to the measured data and the more accurate Equation set was recorded. The process is repeated 20 times per virtual participant with new noise added to the clean data set at each iteration. Thus 10000 virtual trials are tested.
If the small positive and zero saturation effect terms show equal accuracies across this in-silico analysis, but the analysis using the real clinical data shows a significant bias, it could be concluded that the proposed methods are capturing some effect, and not merely noise. Some studies use complex mathematical expressions and methods to define ambiguous or obscure parameters that are often merely functions of noise in the clinical data [26Ghosh S, Maka S. A NARX modeling-based approach for evaluation of insulin sensitivity Biomed Signal Process Control 2008; 4(1): 49-56.-28Hovorka R, Chassin LJ, Wilinska ME, et al. Closing the loop: the adicol experience Diabetes Technol Ther 2004; 6(3): 307-18.]. This analysis could show that the method presented is not doing this. Instead it tests whether, in the presence of noise over synthetic data, no effect (or bias in saturation value) is identified.
Statistical Analysis
An indication of the accurate identification of saturation effects can be found by comparing the bias of the in-silico test to the bias found using the clinical data. If the in-silico analysis finds a positive saturation in approximately 50% of the cases it will show that the method does not pick up saturation effects when in-fact there is only noise. If the method finds a positive saturation in greater proportions with the real cohort, an observed effect can be confirmed.
The iterative integral method used to identify the variable parameters in each presented model drives the parameter identification by minimising the 2-norm error metric. Thus to best evaluate the applicability of the models, the data-fitting accuracy was identified using the 2-norms of the difference between the measured and simulated insulin and glucose concentrations. For ease of comparison, the mean 2-norm for each species and model is divided by the mean 2-norm for the species from all models. Thus, for each model, a normalised data-fitting error metric is presented for both glucose and insulin simulations enabling a comparison of model performance at a species level.
Furthermore, the inter-test, intra-subject parameter variations are used to show the robustness of metrics of the three models. Equation 10 defines the intra-subject variations.
The mean inter-subject plasma insulin level at 50% maximal action (I50) is presented to show how the derived metrics compare to the published metrics of stepped, and multiple clamp test investigations [2Natali A, Gastaldelli A, Camastra S, et al. Dose-response characteristics of insulin action on glucose metabolism: a non-steady-state approach Am J Physiol Endocrinol Metab 2000; 278(5): E794-801., 6Kolterman OG, Insel I, Saekow M. Mechanisms of insulin resistance in human obesity: evidence for receptor and postreceptor defects J Clin Invest 1980; 65(6): 1272-84., 17Laakso M, Edelman SV, Brechel G, et al. Decreased effect of inuslin to stimulate skeletal muscle blood flow in Obese man: A novel mechanism for insulin resistance J Clin Invest 1990; 85(6): 1844-52., 18Rizza RA, Mandarino LJ, Gerich JE. Dose-response characteristics for effects of insulin on production and utilization of glucose in man Am J Physiol 1981; 240(6): E630-9.]. Although glucose disposal is dependent on interstitial insulin, the corresponding plasma level is used to gain equivalence with the findings of previously published stepped clamp investigations. Equation 11 defines the equivalent plasma level at Q50 by utilising a steady state ratio of 0.5 between the plasma and interstitium [29Castillo C, Bogardus C, Bergman R, et al. Interstitial insulin concentrations determine glucose uptake rates but not insulin resistance in lean and obese men J Clin Invest 1994; 93(1): 10-6.-32Barrett EJ, Eggleston EM, Inyard AC, et al. The vascular actions of insulin control its delivery to muscle and regulate the rate-limiting step in skeletal muscle insulin action Diabetologia 2009; 52(5): 752-64.].
RESULTS
All tests achieved convergence for all identified parameters in all models. No re-simulated profiles were divergent from the measured data. The 10000 virtual trial in-silico analysis showed that the small positive saturation term out performs the linear assumption 49.79% of the time (in terms of fitting accuracy). In comparison, the real clinical data analysis showed that greater accuracy was achieved with a non-zero saturation term 73.9% of the time (p<0.002). Hence, the identification method was robust in the presence of noise and a false effect was not identified.
Table 2 shows the re-simulation accuracy and relative values of the respective terms and models, both as a whole study population and divided into diabetes diagnosis. Fig. (2 ) shows insulin action profiles from the three models for a typical NGT test participant.
The mean insulin concentration at half maximal action (I50) for the total population was found as 139.3 mU·L-1 (CV =130.5%). There were almost significant (p=0.092) differences between the NGT and T2D-IFG subgroups I50 values, whereas the SIS values for these groups were indistinguishable. The SIL and SIG parameters showed a difference between these groups whereas the SG term showed no such contrast. Table 3 shows that the I50 values found in this analysis were within the wide range of previously published values that were either derived using multiple or stepped EIC protocols [2Natali A, Gastaldelli A, Camastra S, et al. Dose-response characteristics of insulin action on glucose metabolism: a non-steady-state approach Am J Physiol Endocrinol Metab 2000; 278(5): E794-801., 6Kolterman OG, Insel I, Saekow M. Mechanisms of insulin resistance in human obesity: evidence for receptor and postreceptor defects J Clin Invest 1980; 65(6): 1272-84., 17Laakso M, Edelman SV, Brechel G, et al. Decreased effect of inuslin to stimulate skeletal muscle blood flow in Obese man: A novel mechanism for insulin resistance J Clin Invest 1990; 85(6): 1844-52., 18Rizza RA, Mandarino LJ, Gerich JE. Dose-response characteristics for effects of insulin on production and utilization of glucose in man Am J Physiol 1981; 240(6): E630-9.].
DISCUSSION
The novel methods presented in this article allow identification of saturation parameters from relatively low-dose, 40-50 minute dynamic tests. However, the intra-subject repeatability of the derived metrics is not of sufficient resolution to promote the use of the method to identify a saturation threshold for an individual. The population trend of higher I50 values in the IFG-T2DM subgroup observed in this study has also been reported previously [2Natali A, Gastaldelli A, Camastra S, et al. Dose-response characteristics of insulin action on glucose metabolism: a non-steady-state approach Am J Physiol Endocrinol Metab 2000; 278(5): E794-801., 6Kolterman OG, Insel I, Saekow M. Mechanisms of insulin resistance in human obesity: evidence for receptor and postreceptor defects J Clin Invest 1980; 65(6): 1272-84., 17Laakso M, Edelman SV, Brechel G, et al. Decreased effect of inuslin to stimulate skeletal muscle blood flow in Obese man: A novel mechanism for insulin resistance J Clin Invest 1990; 85(6): 1844-52.].
The saturation model also produced, more accurate numerical data-fitting re-simulations than either the proportional model or the SG free variable model. This result indicates that the method was truly detecting small levels of saturation of insulin action for most participants. This outcome would match expectations given the relatively low dose data available for this study.
The improvement of insulin data fit was slight when considering the additional variable in Equation 6 (Q50). However, there was a significant improvement in the glucose data fit obtained using the saturation model. This would imply that the saturation effect is most evident in the glucose data. Furthermore the glucose model fit error showed the increased fit accuracy possible with the added model variables. However, the saturation variable (Q50) showed a significant further data fit advantage over the added variable of the SG free variable model. Thus implying the presence of saturation effects in the data and the suitability of the saturation model for analysing glucose data.
To date, studies that derive a parameter for saturation have used stepped clamp tests [2Natali A, Gastaldelli A, Camastra S, et al. Dose-response characteristics of insulin action on glucose metabolism: a non-steady-state approach Am J Physiol Endocrinol Metab 2000; 278(5): E794-801.], multiple clamp tests [6Kolterman OG, Insel I, Saekow M. Mechanisms of insulin resistance in human obesity: evidence for receptor and postreceptor defects J Clin Invest 1980; 65(6): 1272-84.], or multiple insulin-modified IVGTT tests at various insulin or glycaemic doses [3Prigeon RL, Roder ME, Porte D Jr, et al. The effect of insulin dose on the measurement of insulin sensitivity by the minimal model technique. Evidence for saturable insulin transport in humans J Clin Invest 1996; 97(2): 501-7.]. These tests are arduous in terms of clinical intensity and time. A typical three-step clamp protocol will take over six hours of patient and clinician time. Hence, most importantly, this study shows that saturation of insulin sensitivity identification is achievable with a single 40-50 minute test, albeit an identification with a potentially high inter-test variability.
The stepped clamp and multiple clamp studies found physiological I50 values for 100% of subjects. However, none of the studies provided an intra-subject repeatability analysis so these results cannot be put further into context. In addition, their much higher insulin doses, well into saturation ranges, provide better resolution to identify this parameter, but also carry increased risk to the participant and thus added clinical burden as well.
The potential reasons behind the poor repeatability of the proposed saturation model are the decreased robustness of the solver in the presence of assay error and physiological and assay noise (such as mixing) [11Lotz T. 'High resolution clinical model-based assessment of insulin sensitivity' (PhD Thesis).http://hdl.handle.net/10092/1571. Christchurch, New Zealand: University of Canterbury 2007., 33Mari A. Assessment of insulin sensitivity and secretion with the labelled intravenous glucose tolerance test: improved modelling analysis Diabetologia 1998; 41(9): 1029-39.]. Such noise provokes the interference issues frequently observed when deriving SG and SI with the minimal model [24Caumo A, Vicini P, Zachwieja JJ, et al. Undermodeling affects minimal model indexes: insights from a two-compartment model Am J Physiol 1999; 276(6 Pt 1): E1171-93., 25Pillonetto G, Sparacino G, Magni P, et al. Minimal model S(I)=0 problem in NIDDM subjects: nonzero Bayesian estimates with credible confidence intervals Am J Physiol Endocrinol Metab 2002; 282(3): E564-73.]. These issues would be exasperated by low insulin doses.
Both the saturation model of Equations 6-7 and the SG free variable model of Equation 8 utilise two free variables to model the glucose decay. Thus, some noise-generated parameter trade-off error is expected. These issues are exacerbated when the free variables in both the saturation and SG free variable models are coupled to the functions of glucose concentration. In simpler terms, while the iterative methods identify the values that minimise the least–square simulation error, the noise in the data causes identifiability issues for multiple free variables, even though the noise-free systems are theoretically identifiable [34Bellu G, Saccomani MP, Audoly S, et al. DAISY: A new software tool to test global identifiability of biological and physiological systems Comput Methods Programs Biomed 2007; 88(1): 52-61.].
Table 2 shows that the saturable and SG free variable models produced a higher intra-subject parameter variability than the proportional model. This result is likely to be an artefact of the number of free variables used by the respective models. Indeed, it could be assumed that the saturable model produces results in accordance with what should be expected by models that utilise two free variables to model glucose decay in short duration dynamic tests.
The p-value between the in-silico analysis and the real data confirms that the reduction in error is not due entirely to noise fitting. However, the reduction in error could be attributed to the addition of a second free variable. Both the SG free variable and saturation models achieved a lower mean residual error than the proportional model. However, the reduction in error for the SG free variable model was smaller compared to the saturation model. Thus, it could be concluded that if a second variable is to be included and identified, it is more physiologically favourable to identify a saturation variable than the glucose dependant clearance rate (SG).
Improvements in assay techniques may reduce the level of noise in the data. Thus enabling the methods presented to more accurately and repeatably identify these parameters. However, it is likely that the physiological mixing effects that are present during this type of dynamic test will limit any potential improvements obtained by a more accurate assay. This issue would be further compounded by a relatively low sampling rate of 5-10 minutes in the DIST designed to reduce cost and patient/clinical burden [11Lotz T. 'High resolution clinical model-based assessment of insulin sensitivity' (PhD Thesis).http://hdl.handle.net/10092/1571. Christchurch, New Zealand: University of Canterbury 2007.]. However, it suggests that a modified test protocol with an increased sampling frequency, larger or repeated boluses may provide better insight or stability in results.
Furthermore, the dosing levels of the DIST test were purposefully lower than those used by comparable tests to avoid significant saturation effects, while still allowing detection of a signal and physiological relevance. This low dose, acting as designed, will have partially hidden the saturation effect that this study attempted to measure. The average interstitial insulin concentration reached during the DIST tests (36.6 mU·L-1) was significantly below the average identified Q50 value. In contrast, most stepped clamp studies achieve plasma insulin concentrations significantly above I50. For example, Natali et al. [2Natali A, Gastaldelli A, Camastra S, et al. Dose-response characteristics of insulin action on glucose metabolism: a non-steady-state approach Am J Physiol Endocrinol Metab 2000; 278(5): E794-801.] achieved an average plasma insulin concentration of 509 mU·L-1 with a 200 mU·m-2·min-1 infusion and found an average I50 of 293 mU·L-1. This research attempted to identify the saturation effect with data that generally lies toward the linear region of the saturation curve in Fig. (1). Hence a limitation in this study is the lack of higher dose data which was unavailable to better prove the concept. Thus, the proportional model is the most appropriate model to identify metrics from the DIST test.
A significant finding of this study is shown in the p-values for SIS and αQ in Table 2. There is virtually no difference between the mean SIS metrics for the two subgroups (p=0.65). However, there is an almost significant difference between the mean I50 metrics (p=0.092). Physiologically, this result may imply that most people have similar insulin efficiency or sensitivity at the receptor level once insulin has been activated by the cell or at very low concentrations, and observed differences could instead be caused by saturation dynamics. In particular, a lack of receptors may limit sensitivity, and not the binding rate to them. Thus, much of the differences observed in proportional SI metrics from other studies could be affected by these saturation dynamics at cellular and receptor level, particularly if dosing is not patient specific. This hypothesis offers an interesting and physiologically justified insight, but remains to be proven by a purpose driven test.
The mechanisms by which insulin action saturation occurs have not been confirmed. However, most studies which have investigated the matter have promoted either a transportation delay of insulin to the skeletal muscle amongst insulin resistant individuals [3Prigeon RL, Roder ME, Porte D Jr, et al. The effect of insulin dose on the measurement of insulin sensitivity by the minimal model technique. Evidence for saturable insulin transport in humans J Clin Invest 1996; 97(2): 501-7., 32Barrett EJ, Eggleston EM, Inyard AC, et al. The vascular actions of insulin control its delivery to muscle and regulate the rate-limiting step in skeletal muscle insulin action Diabetologia 2009; 52(5): 752-64.], a lower intensity or availability of insulin receptors at the cell [6Kolterman OG, Insel I, Saekow M. Mechanisms of insulin resistance in human obesity: evidence for receptor and postreceptor defects J Clin Invest 1980; 65(6): 1272-84.], or both [17Laakso M, Edelman SV, Brechel G, et al. Decreased effect of inuslin to stimulate skeletal muscle blood flow in Obese man: A novel mechanism for insulin resistance J Clin Invest 1990; 85(6): 1844-52.]. If the former were the case, significant saturation effects would be more prominent in dynamic than steady state tests. The latter would show similar results across protocols. To date no such intra-subject cross-over investigations have been undertaken. However, this study has shown similar findings to the previous clamp investigations, implying that some ‘at the cell’ effect is likely.
It can be concluded by the reduction in simulation error caused by the incorporation of the saturation parameter that the proportional model (Equations 3-5) does not fully capture some of the subtle variations of the test dynamics. However, it cannot be safely concluded from the analysis presented that it was only saturation effects that caused this error reduction. It is well known that endogenous glucose production (EGP) can become suppressed in the presence of elevated blood glucose and insulin concentrations [35Del Prato S, Matsuda M, Simonson DC, et al. Studies in the mass action effect of glucose in NIDDM and IDDM: evidence for glucose resistance Diabetologia 1997; 40(6 ): 687-97.-37DeFronzo RA, Tobin JD, Andres R. Glucose clamp technique: a method for quantifying insulin secretion and resistance Am J Physiol 1979; 237(3): E214-23.]. Although it is assumed that these suppressions have a small effect [38Regittnig W, Trajanoski Z, Leis HJ, et al. Plasma and interstitial glucose dynamics after intravenous glucose injection: evaluation of the single-compartment glucose distribution assumption in the minimal models Diabetes 1999; 48(5): 1070-81.], they may be of similar magnitude to the saturation effects detected in this study. In particular, Equations 5, 7 and 8 assume that basal insulin-dependant and non-insulin-dependent glucose clearance is equal and opposite to EGP (as it is in the basal state) for the duration of the test and is thus cancelled out of the equations. However, the suppression of EGP would result in the opposite effect to saturation; the observed rate of glucose decay would be greater than expected during a period of elevated insulin rather than lesser as occurs with the saturation model. Tracer glucose studies with a purpose-specific test would be required to further delineate this effect, but would also add significant clinical burden and ethical considerations.
CONCLUSION
The novel techniques presented in this article allow a unique identification of a physiologically justifiable, saturation value trend from a single dynamic test at a population level. Despite the robust identification methods, the high intra-patient variability implies that significant development of the protocol is required before high accuracy in saturation parameter identification is possible from single dynamic tests at an individual level. Potential protocol improvements may include larger, and possibly, repeated boluses. The saturation model showed similar accuracy in terms of parameter variation to generally accepted two parameter models, and allowed better fits to the clinical data. However, despite the increased fitting accuracy of the saturation model, the single parameter proportional model is the most stable, and thus it should be used for individual tests.
The comparable sensitivity coefficients between IFG-T2DM and NGT sub-groups with disparate saturation thresholds implies that an ‘at-the-cell’ effect is the rate limiting factor in glucose disposal. Thus an insulin action saturation threshold may be a significant governing factor of insulin resistance.
ACKNOWLEDGEMENT
The authors thank Professor Jim I. Mann for providing the DIST pilot study data used in this analysis.
REFERENCES
| [1] | Black PR, Brooks DC, Bessey PQ, et al. Mechanisms of insulin resistance following injury Ann Surg 1982; 196(4): 420-35. |
| [2] | Natali A, Gastaldelli A, Camastra S, et al. Dose-response characteristics of insulin action on glucose metabolism: a non-steady-state approach Am J Physiol Endocrinol Metab 2000; 278(5): E794-801. |
| [3] | Prigeon RL, Roder ME, Porte D Jr, et al. The effect of insulin dose on the measurement of insulin sensitivity by the minimal model technique. Evidence for saturable insulin transport in humans J Clin Invest 1996; 97(2): 501-7. |
| [4] | Ferrannini E, Mari A. How to measure insulin sensitivity J Hypertens 1998; 16(7): 895-906. |
| [5] | Sowell M, Mukhopadhyay N, Cavazzoni P, et al. Evaluation of inuslin sensitivity in healthy volunteers treated with olanzapine, resperidone, or placebo: a prospective, randomised study using the two-step hyperinsulinemic, euglyemic clamp J Clin Endocrinol Metab 2003; 88(12): 5875-80. |
| [6] | Kolterman OG, Insel I, Saekow M. Mechanisms of insulin resistance in human obesity: evidence for receptor and postreceptor defects J Clin Invest 1980; 65(6): 1272-84. |
| [7] | Chase JG, Shaw GM, Le Compte AJ, et al. Implementation and evaluation of the SPRINT protocol for tight glycaemic control in critically ill patients: a clinical pratice change Crit Care 2008; 12(3): 156. |
| [8] | Lin J, Lee DS, Chase JG, et al. Stocastic modelling of insulin sensitivity and adaptive glycemic control for critial care Comput Methods Programs Biomed 2008; 89(2): 141-52. |
| [9] | Wong XW, Chase JG, Hann CE, et al. Development of clinical type 1 diabetes metabolic system model and in silico simulation tool J Diabetes Sci Technol 2008; 2(3): 424-35. |
| [10] | Lotz T, Chase JG, McAuley KA, et al. Monte Carlo analysis of a new model-based method for insulin sensitivity testing Comput Methods Programs Biomed 2008; 89: 215-5. |
| [11] | Lotz T. 'High resolution clinical model-based assessment of insulin sensitivity' (PhD Thesis).http://hdl.handle.net/10092/1571. Christchurch, New Zealand: University of Canterbury 2007. |
| [12] | McAuley KA, Mann JI, Chase JG, et al. Point: HOMA - Satisfactory for the Time Being: HOMA: the best bet for the simple determination of insulin sensitivity, until something better comes along Diabetes Care 2007; 30(9): 2411-3. |
| [13] | Chase JG, Shaw GM, Lin J, et al. Impact of insulin-stimulated glucose removal saturation on dynamic modelling and control of hyperglycaemia Int J Intell Syst Technol Appl (IJISTA) 2004; 1(1/2): 79-94. |
| [14] | Pielmeier U, Andreassen S, Nielsen BS, et al. A simulation model of insulin saturation and glucose balance for glycamic control in ICU patients Comput Methods Programs Biomed 2010; 97(3): 211-2. |
| [15] | Bergman RN, Prager R, Volund A, et al. Equivalence of the insulin sensitivity index in man derived by the minimal model method and the euglycemic glucose clamp J Clin Invest 1987; 79(3): 790-800. |
| [16] | Bergman RN, Ider YZ, Bowden CR, et al. Quantitative estimation of insulin sensitivity Am J Physiol 1979; 236(6): E667-77. |
| [17] | Laakso M, Edelman SV, Brechel G, et al. Decreased effect of inuslin to stimulate skeletal muscle blood flow in Obese man: A novel mechanism for insulin resistance J Clin Invest 1990; 85(6): 1844-52. |
| [18] | Rizza RA, Mandarino LJ, Gerich JE. Dose-response characteristics for effects of insulin on production and utilization of glucose in man Am J Physiol 1981; 240(6): E630-9. |
| [19] | Van Cauter E, Mestrez F, Sturis J, et al. Estimation of insulin secretion rates from C-peptide levels. Comparison of individual and standard kinetic parameters for C-peptide clearance Diabetes 1992; 41(3): 368-77. |
| [20] | Hann CE, Chase JG, Lin J, et al. Integral-based parameter identification for long-term dynamic verification of a glucose-insulin system model Comput Methods Programs Biomed 2005; 77(3): 259-70. |
| [21] | Docherty PD, Chase JG, Lotz T, et al. DISTq: An iterative analysis of glucose data for low-cost real-time and accurate estimation of insulin sensitivity Open Med Inform J 2009; 3: 65-76. |
| [22] | Kim C, Kim SB. Modelling contaminant transport in a three-phase groundwater system with the Freundlich-type retardation factor Environ Technol 2007; 28(2): 205-16. |
| [23] | Youssef IK, El-Arabawy HA. Picard iteration algorithm combined with Gauss-Seidel technique for initial value problems Appl Math Comput 2007; 190(1): 345-55. |
| [24] | Caumo A, Vicini P, Zachwieja JJ, et al. Undermodeling affects minimal model indexes: insights from a two-compartment model Am J Physiol 1999; 276(6 Pt 1): E1171-93. |
| [25] | Pillonetto G, Sparacino G, Magni P, et al. Minimal model S(I)=0 problem in NIDDM subjects: nonzero Bayesian estimates with credible confidence intervals Am J Physiol Endocrinol Metab 2002; 282(3): E564-73. |
| [26] | Ghosh S, Maka S. A NARX modeling-based approach for evaluation of insulin sensitivity Biomed Signal Process Control 2008; 4(1): 49-56. |
| [27] | Ackerman E, Gatewood L, Rosevear J, et al. Model studies of blood-glucose regulation Bull Math Biophys 1965; 27(1): 21-37. |
| [28] | Hovorka R, Chassin LJ, Wilinska ME, et al. Closing the loop: the adicol experience Diabetes Technol Ther 2004; 6(3): 307-18. |
| [29] | Castillo C, Bogardus C, Bergman R, et al. Interstitial insulin concentrations determine glucose uptake rates but not insulin resistance in lean and obese men J Clin Invest 1994; 93(1): 10-6. |
| [30] | Steil GM, Ader M, Moore DM, et al. Transendothelial insulin transport is not saturable in vivo. No evidence for a receptor-mediated process J Clin Invest 1996; 97(6): 1497-503. |
| [31] | Yang YJ, Hope ID, Ader M, et al. Insulin transport across capillaries is rate limiting for insulin action in dogs J Clin Invest 1989; 84(5): 1620-8. |
| [32] | Barrett EJ, Eggleston EM, Inyard AC, et al. The vascular actions of insulin control its delivery to muscle and regulate the rate-limiting step in skeletal muscle insulin action Diabetologia 2009; 52(5): 752-64. |
| [33] | Mari A. Assessment of insulin sensitivity and secretion with the labelled intravenous glucose tolerance test: improved modelling analysis Diabetologia 1998; 41(9): 1029-39. |
| [34] | Bellu G, Saccomani MP, Audoly S, et al. DAISY: A new software tool to test global identifiability of biological and physiological systems Comput Methods Programs Biomed 2007; 88(1): 52-61. |
| [35] | Del Prato S, Matsuda M, Simonson DC, et al. Studies in the mass action effect of glucose in NIDDM and IDDM: evidence for glucose resistance Diabetologia 1997; 40(6 ): 687-97. |
| [36] | Bergman RN, Finegood DT, Ader M. Assessment of insulin sensitivity in vivo Endocr Rev 1985; 6(1): 45-86. |
| [37] | DeFronzo RA, Tobin JD, Andres R. Glucose clamp technique: a method for quantifying insulin secretion and resistance Am J Physiol 1979; 237(3): E214-23. |
| [38] | Regittnig W, Trajanoski Z, Leis HJ, et al. Plasma and interstitial glucose dynamics after intravenous glucose injection: evaluation of the single-compartment glucose distribution assumption in the minimal models Diabetes 1999; 48(5): 1070-81. |