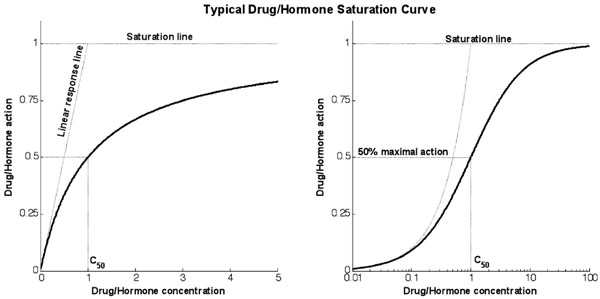
Fig. (1)
Typical response curve for any typical saturative drug or hormone. The graphs use proportional and logarithmic x-axis for the same response (linear gradient of 1 and saturation maximum of 1).