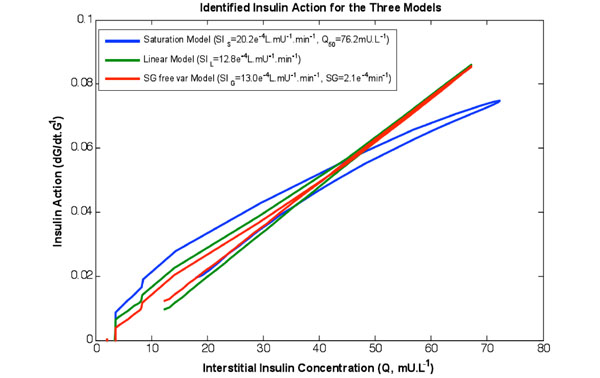
Fig. (2) The rate of change of available glucose as a function of the insulin concentration in the interstitium for the three models identified on the same data set. Note the curved shape of the saturation model captures the behaviour of Fig. (1, left). Furthermore the linear and SG free variable models almost overlay.