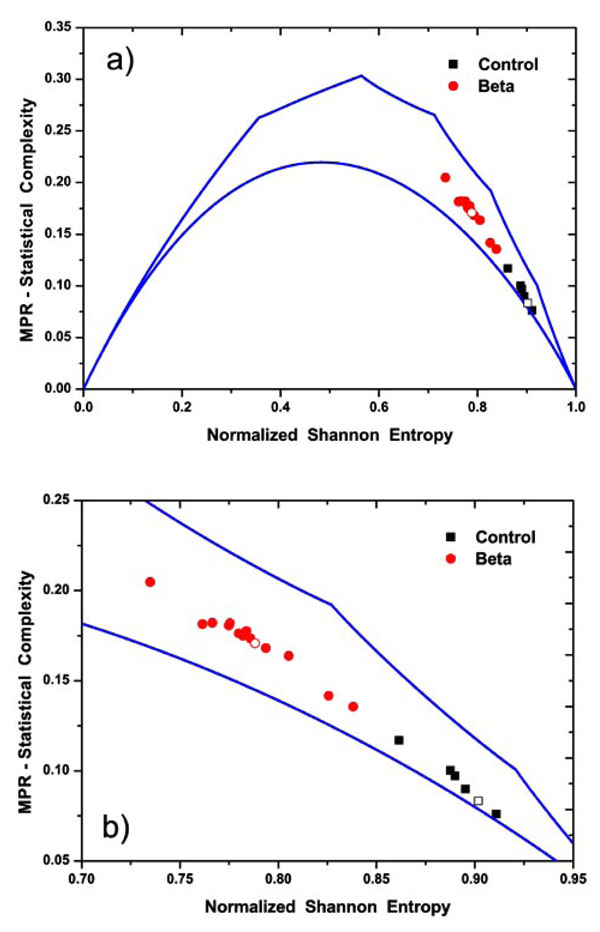
Fig. (7) a) Entropy-Complexity plane for N = 7. The continuous lines display the bound curves Cmin and Cmax associated to the maximum and minimum values of complexity for a fixed value of the normalized entropy. Also, different marks are used to distinguish the numerical calculated values for controls and β-thalassaemia signals. The open symbols correspond to the values obtained using the corresponding grand average of Relative Wavelet Energy (see Fig. 4). b) Detail of the Entropy-Complexity plane.