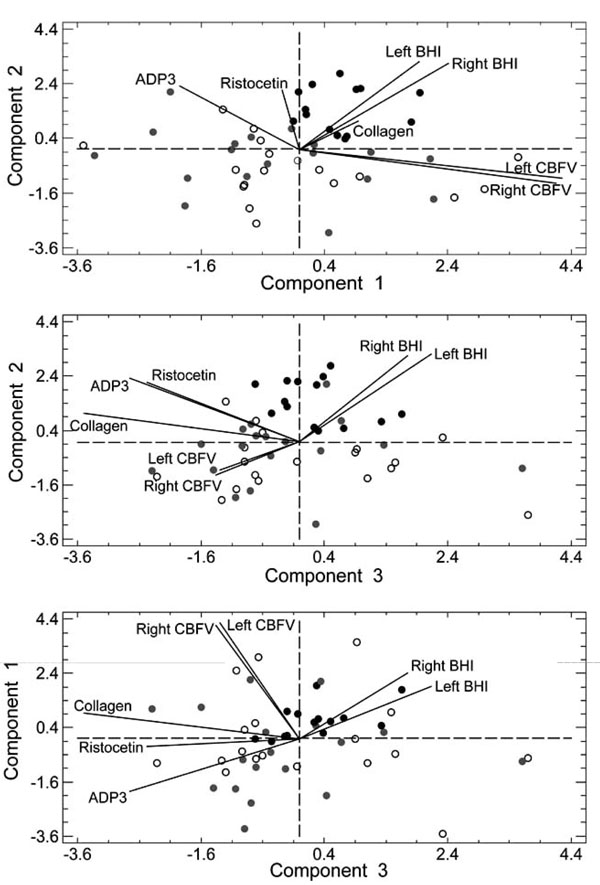
Fig. (2) PCA representation of the subjects in the three hyperplanes. Black circles represent the subjects in the T/T677 group, gray circles those in the C/T677 group, and white circles those without mutation. The dashed lines represent the zero level of the principal components. The black lines represent the projection of the original variables on the hyperplanes. Upper panel: PC1 vs PC2. Central panel: PC3 vs PC2. Lower panel: PC3 vs PC1.