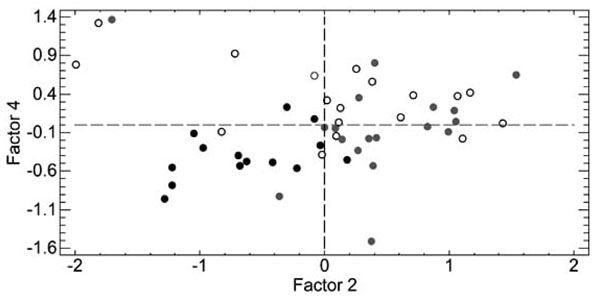
Fig. (3) Sample PLS representation of the subjects in the hyperplane defined by Factor 2 and Factor 4 (factors are numerically reported by table VI). Black circles represent the subjects in the T/T677 group, gray circles those in the C/T677 group, and white circles those without mutation. The dashed lines represent the zero level of the principal components. It can be observed that Factor 2 separates the genetic mutation T/T677 (left part of the chart – black circles) from the C/T677 (right part of the chart – gray circles).