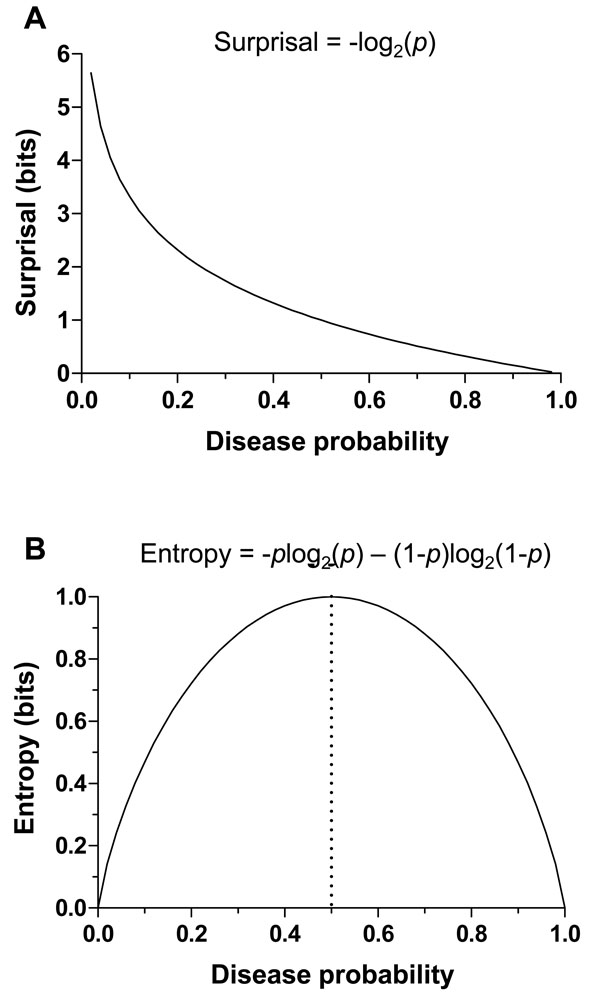
Fig. (2) Surprisal and entropy functions. (A) The surprisal
function is shown across the probability range from 0 to 1. (B) The
binary entropy function for dichotomous disease status is shown
across the probability range from 0 to 1. The maximal entropy
occurs at p = 0.5 (dotted line).