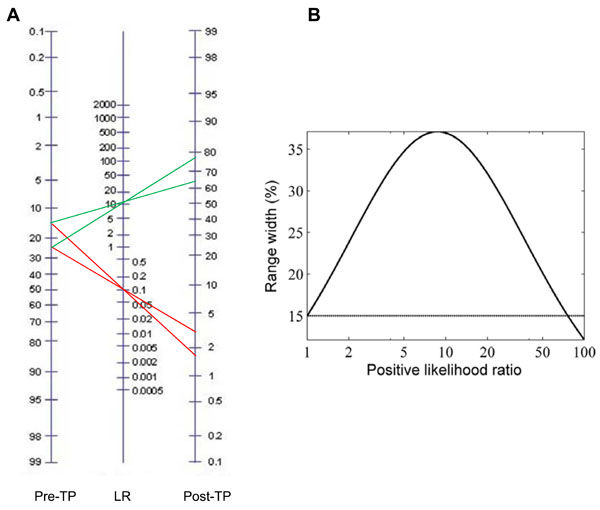
Fig. (5) Test results project pre-TP ranges into post-TP ranges. (A) The pre-TP range of 15-25% is projected through a positive and a
negative test result using the Bayes nomogram. The positive test result is unexpected (since pre-TP was low), and the resulting post-TP range
is expanded (~64-77%). In contrast, the negative test result markedly reduces the probability range, with a post-TP of ~1.5-3%. (B) Starting
from a pre-TP range of 15% (horizontal line), the width of the post-TP range at first increases with LR(+), peaks, then decreases and, for
strong enough tests, ultimately becomes narrower than the width of the pre-TP range.