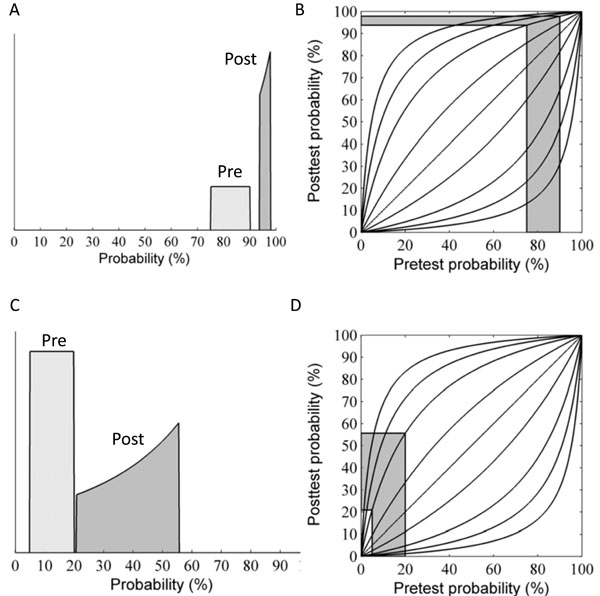
Fig. (6) Stretching and warping effects of test results on disease pre-TP distributions. (A) A uniform distribution over the range 75-90%
(width = 15%) is transformed by an expected positive test result with LR(+) = 5 into a shifted and warped non-uniform distribution over a
narrower range, 94-98% (width = 4%). (B) The reason for the shifting, warping, and range-narrowing is evident from the “football” plot,
showing how Bayes’ rule nonlinearly maps pre-test probabilities into post-test probabilities. (C) A uniform distribution over the range 5-20%
(width 15%) is transformed by an unexpected positive test result when LR(+) = 10 into a shifted and warped non-uniform distribution over a
wider range, 34-71% (width = 37%). (D) Football plot showing the reasons for the shifting, warping, and widening.