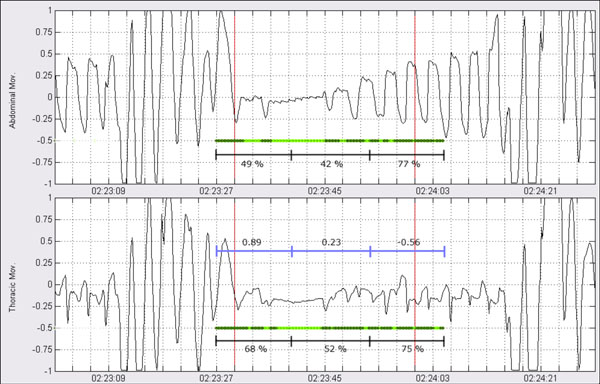
Fig. (19) Classification processing: Each derivation is divided into three intervals and amount of presence of movement is computed. Percentages are shown below marks of previous segmentation. Linear correlation between the two signals is also computed for each subinterval. Resulting correlation is shown in the middle of the figure.