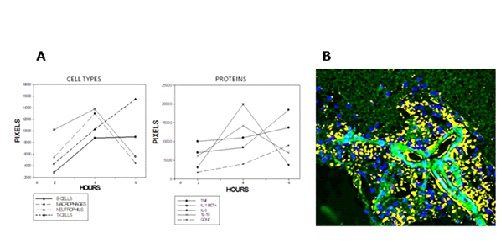
Fig. (2)
Shows data that attests to a robust inflammatory response. The graph on the left (Panel A - Cell Types) details the increasing number of lymphocytes in the olfactory bulb >6 hours, while cytokines also increase in concentration (Panel A - Proteins), particularly TNFα and interleukin-6. The GDNF concentration also reveals a gradual increase, up to at least 12 hours. The fluorescent image reveals a dense cuff of lymphocytes (yellow) around an arteriole in the olfactory bulb (light green). Nuclei are blue and the dark green indicates the matrix (Magnification x 600) (Panel B).