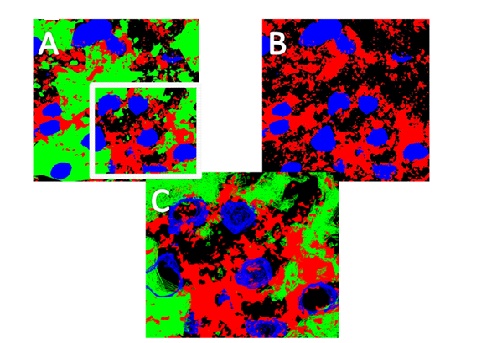
Fig. (6)
is a compilation of images to demonstrate both comparative and methodological properties of image renditions. Panels A, B, C show combinations of nNOS (red), connective tissue (green) and nuclei (blue) as a complete-field stack of all three probes (A), then with the connective tissue removed (B), and finally with part of the image ‘wire-framed’ (Mag x 900) to visualize juxta-positioning of nNOS to assess specificity.