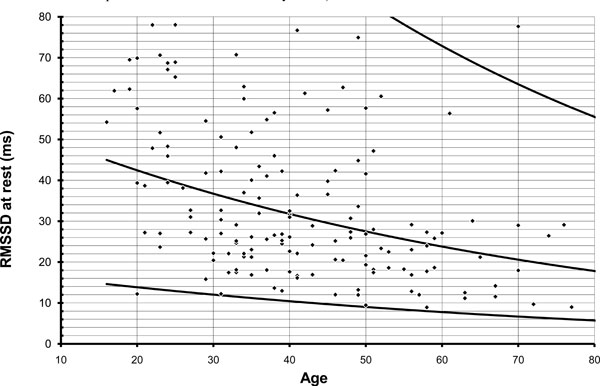
Fig. (1)
All parameters of heart rate variability decrease logarithmically with age. This graph illustrates distribution of individual RMSSD values. Lines indicate mean, 95% CI and 5% CI of individual values.