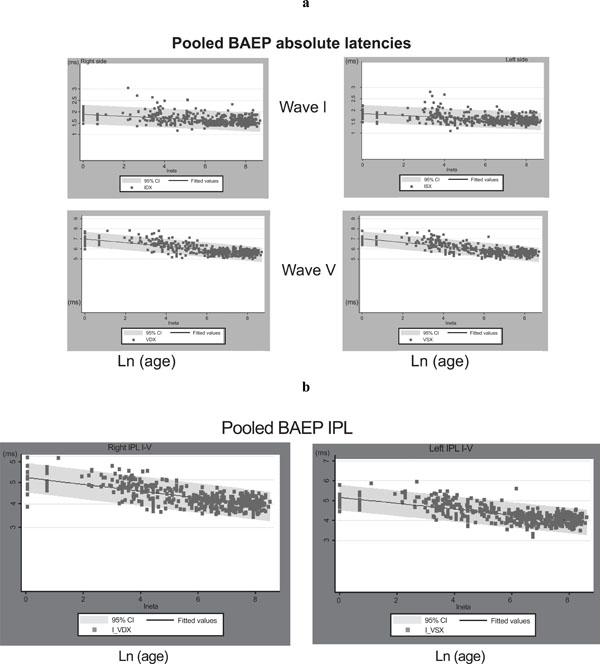
Fig. (4)
a
. Pooled wave I and wave V data plotted against the natural logarithm of age; the regression curve is also shown.
b
. Pooled IPL I-V data plotted against the natural logarithm of age; the regression curve is also shown.