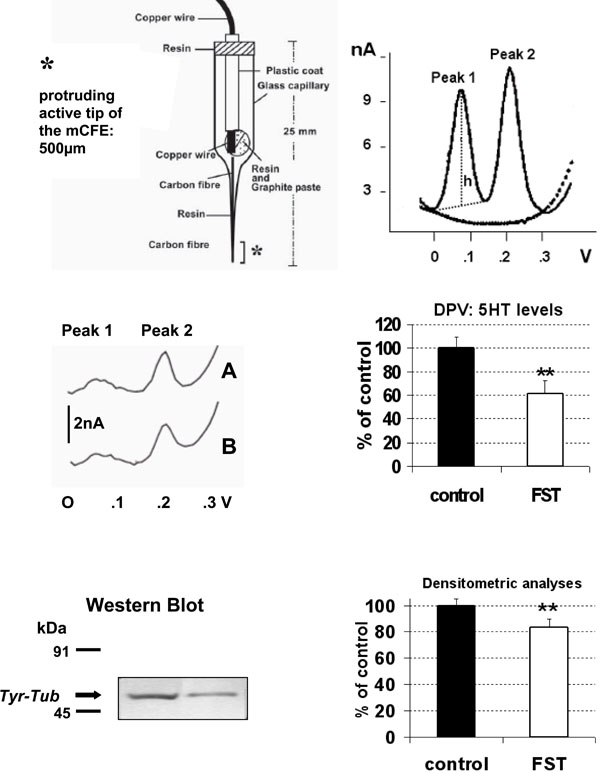
Fig. (2) TOP LEFT: schematic representation of the carbon fibre microelectrode used in the present experiments.TOP RIGHT: differential pulse voltammogram obtained in vitro with Nafion mCFE: dotted line shows signals obtained in phosphate buffer
solution (PBS, pH 7.4), solid line shows Peak 1 at approximately 69mV and Peak 2 at approximately 230mV corresponding to the oxidation
of catecholamines [dopamine or noradrenaline] and 5-HT, respectively (50nM in PBS).h: height of the peak, measured in nanoAmperes (nA: Intensity of current). This perpendicular line also determined the exact potential value
expressed in Volts (V) of each signal on the abscissa.MIDDLE: differential pulse voltammogram obtained in vitro with Nafion mCFE within 200µl sample of the brain homogenate of a naïve (A)
rat or a rat submitted to FST (B) (LEFT) and in six rats each group (RIGHT).BOTTOM: In the same 200µl sample brain homogenate the Tyr-Tub (55 kDa) western blot immunoreactivity was performed (left) and quantified
by densitometric analysis (right).Results are expressed as percent of control (naive rats); n=6 each histogram, mean ± S.D. **p<0.01, Dunnett’s test.