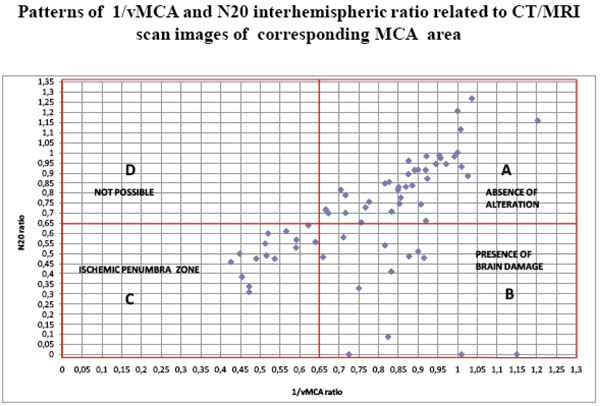
Fig. (12) The scatter diagram shows the distribution of all 66 couples of 1/vMCA and N20 ratio values gathered in Table 3. Each point identifies a couple of 1/vMCA (X axis) and N20 (Y axis) interhemispheric ratio values. In section A, both 1/vMCA and N20 interhemispheric ratio values > 0.65 correspond to CT/MRI normal images of MCA supplied area: this is the area of absence of damage, where N20 amplitude and 1//vMCA values show interhemispheric symmetry. In section B, 1/vMCA ratios > 0.65 coupled with N20 ratios < 0.65 correspond with CT/MRI images of unilateral structural brain damage in the MCA supplied area: this is the brain injury area, where pathological amplitude or absence of N20 reflects the tissue damage, whereas 1/vMCA values reverting to those of the uninjured contralateral area suggests a luxury perfusion state. In section C, both 1/vMCA and N20 interhemispheric ratio values < 0.65 correspond with CT/MRI images of unilateral transient and reversible alterations in MCA supplied area; this condition is capable of reverting to normal (section A) or evolving to stable damage (section B): this section could be named “ ischemic penumbra zone”. In section D no ratio allocation is found: this area would correspond with a condition of unilateral hemispheric alteration of vascular resistances due to reduction of MCA vessel section and consequent low 1/v MCA ratio, in contrast to symmetrical bilateral N20 amplitude and high interhemispheric ratio value. It is reasonable to hypothesize an impossible coexistence of altered regional brain perfusion with normal cortical activity.