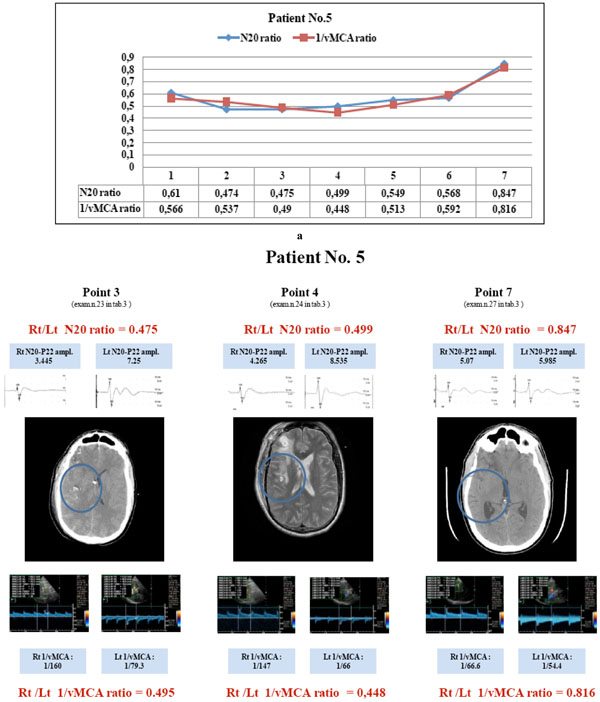
Fig. (6) Patient No. 5: the courses of N20 and 1/vMCA ratios correlate (p < 0.01, r = 0.94, C.I. 0.65 to 0.99). He showed both ratios < 0.65 correspondig to points 1 to 6 (a) and and CT/MRI images of parietal oedema or hypodensity (b, points 3 and 4); the last couple of values > 0.65 (a, point 7) correspond with a re-established normal CT scan (b, point 7). He had vasospasm (BFV >120 <180) corresponding to points 2,3 and 4; he always maintained N20 absolute value > 1,2 µV on the compromised hemisphere; when both ratios reached a value < 0.65 (points 2 to 6), he showed lateralizing symptoms and/or consciousness modification; when both ratios reverted to a value > 0.65 (point 7) he recovered to a normal clinical condition. (N20 amplitude is expressed in µV and MCA blood flow velocity in cm/sec).