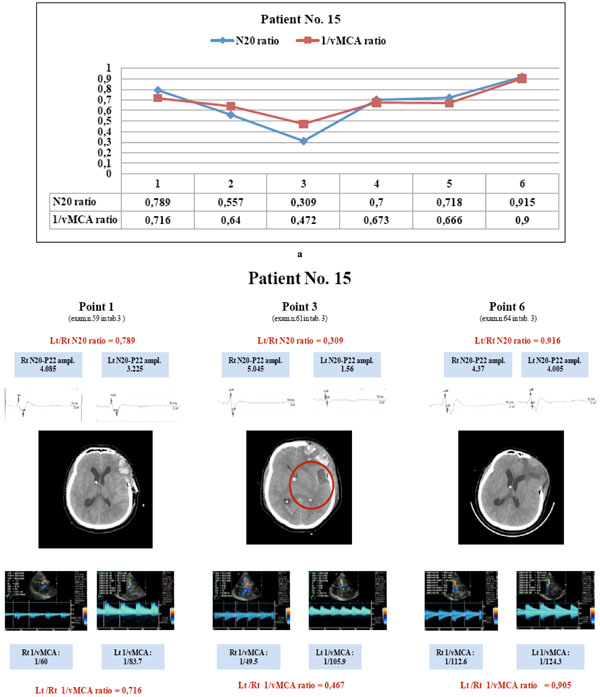
Fig. (8) Patient No. 15: the parallel variations of N20 and 1/vMCA ratio (a) show a statistically significant correlation (p < 0.01, r = 0.94, C.I. 0.58 to 0.99); at first examination both ratio values > 0.65 (a, point 1) corresponded with normal MCA supplied brain area at CT scan (b, point 1); later modifications of both ratios to values < 0.65 (a, points 2,3) corresponded with the appearance of an image of parietal hypodensity at CT scan (b, point 3); the following ratio values > 0.65 corresponded to normalized CT scan (b, point 6). This patient had vasospasm at point 2 (BFV >180<200 cm/sec), had constant > 1.2 µV N20 amplitude, and showed lateralizing symptoms and/or consciousness modification at points 2 and 3 (ratios < 0.65). (N20 amplitude is expressed in µV and MCA blood flow velocity in cm/sec).