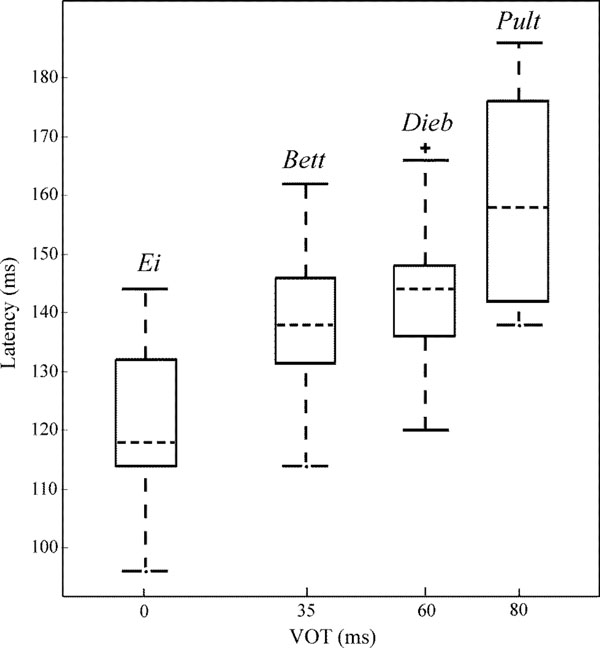
Fig. (7) Box and whisker plot of VOTs of the diverse speech stimuli against the latencies of the negative components in the difference signal of the cortical responses. Dashed lines within the boxes display the median, the edges of the boxes display the quartiles. Whiskers indicate maximal and minimal latencies unless outliers ‘+’ occur (whiskers span 1.5 times the inter-quartile range).