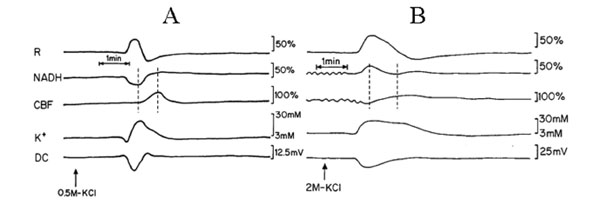
Fig. (2) Analog tracings presenting the effect of CSD initiation during normoxia (A) and hypoxia (B). R – reflectance, NADH – mitochondrial
NADH redox state; CBF– cerebral blood flow; K+e – corrected extracellular potassium concentration; DC – DC steady potential.
The arrows indicate the moment of KCl solution application for induction of CSD wave. Dotted lines in 2A and 2B mark the simultaneous
minimum and maximum responses in CBF and NADH during CSD.