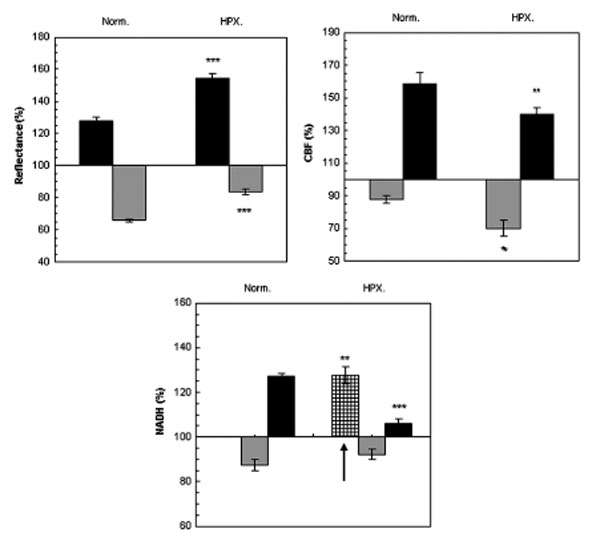
Fig. (3) The effect CSD wave propagation on maximum (VTmax-black bars) and minimum (VTmin-gray bars) amplitudes of reflected
light (reflectance), cerebral blood flow (CBF) and mitochondrial NADH redox state under normoxic (Norm.) and hypoxic
(HPX.) conditions. Arrow signs the initial reduction wave in NADH (grid bar) recorded during hypoxia. Data are presented as mean ± S.E.
* p < 0.05, ** p < 0.005, *** p<0.0005 CSD during normoxia vs. CSD during hypoxia.