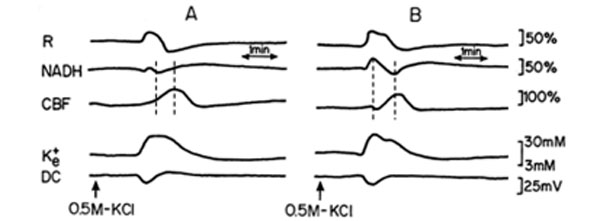
Fig. (4) Analog tracings presenting the effect of CSD propagation on the measured parameters, during normoxia (A), and one hour
after a single dose of 50 mg/kg L-NAME injected IP (B), respectively. R – reflectance, NADH – mitochondrial NADH redox state; CBF –
cerebral blood flow; K+e – corrected extracellular potassium concentration; DC – DC steady potential. The arrows indicate the moment of
KCl solution application for CSD wave induction. Dotted lines in 4A and 4B mark the simultaneous minimum and maximum responses in
CBF and NADH during CSD.