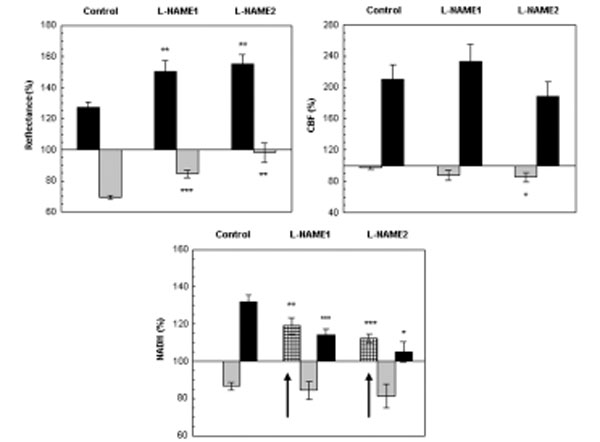
Fig. (5) The effect CSD wave propagation on maximum (VTmax-black bars) and minimum (VTmin-gray bars) amplitudes of reflected
light (reflectance), cerebral blood flow (CBF) and mitochondrial NADH redox state under normoxic (control) and after a
single dose of L-NAME injected IP. L-NAME1 – CSD induced one hour after L-NAME injection and L-NAME2, CSD induced 2 hours
after L-NAME injection. Arrows sign the initial reduction wave in NADH (grid bar) recorded during CSD. Data are presented as mean ±
S.E. * p<0.05, ** p<0.005, *** p<0.0005 CSD during normoxia vs. CSD after L-NAME.