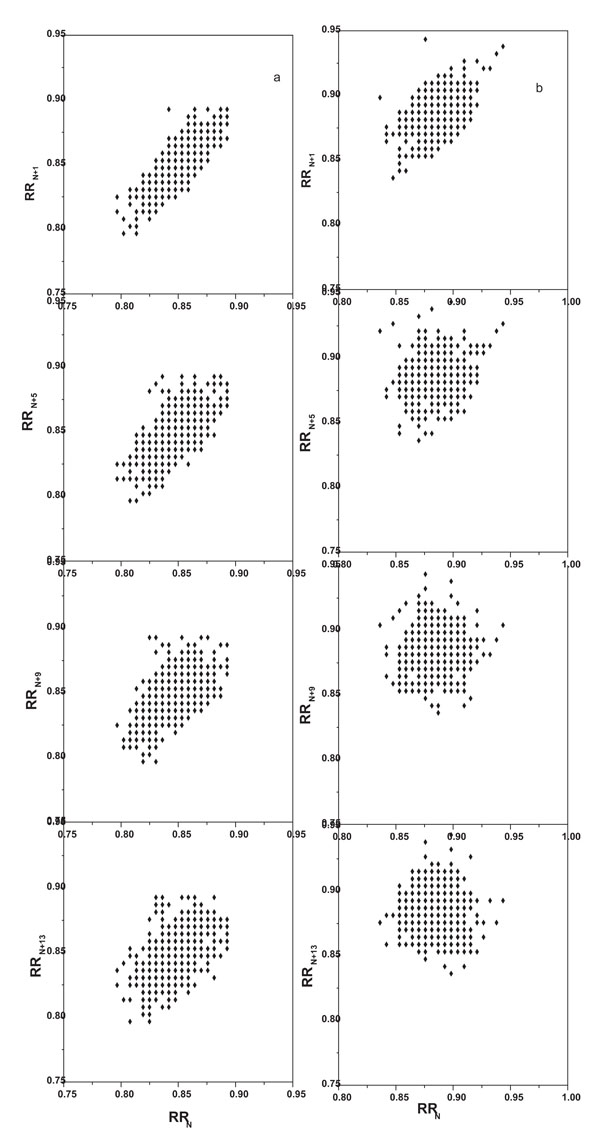
Fig. (1)
lagged Poincaré plot from a representative individual
A
: Pre stimulation,
B
: Post stimulation. From top to bottom panel- lag number 1, 5, 9, 13 respectively.