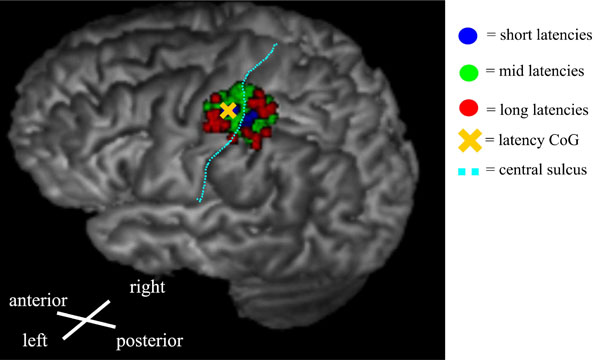
Fig. (3) An example of a latency map from the right-hand FDI muscle showing the distribution of different latency groups. The evaluated categories were short latencies (blue): Shorter than 1 SD below the mean, mid-latencies (green): mean ± 1 SD, and long latencies (red): Longer than 1 SD above the mean. The short latencies were centered in the middle of the map, whereas the longest latencies were distributed near the edges of the map.