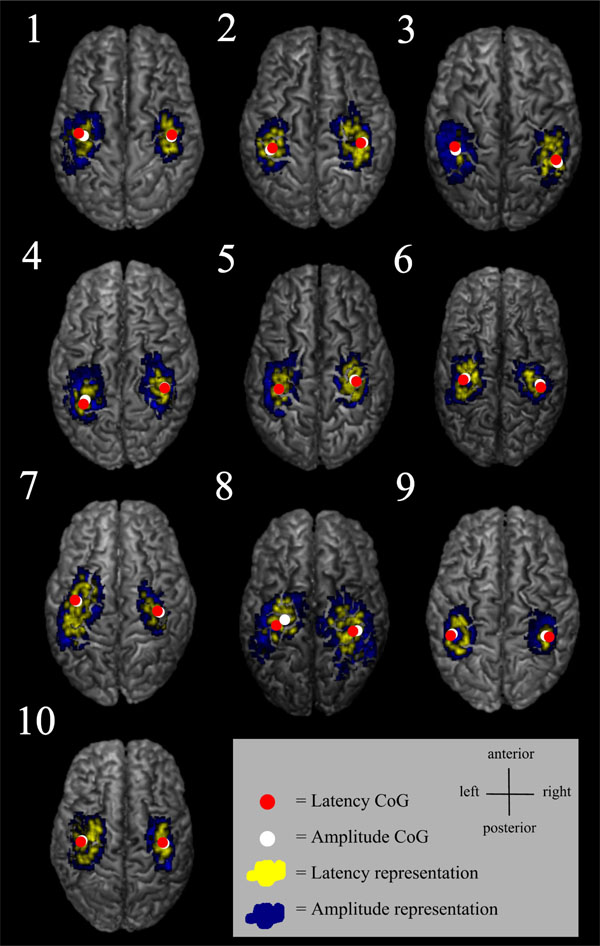
Fig. (5)
Individual MEP latency and amplitude representations from FDI, as well as latency and amplitude CoGs overlaid on individual structural MRIs.