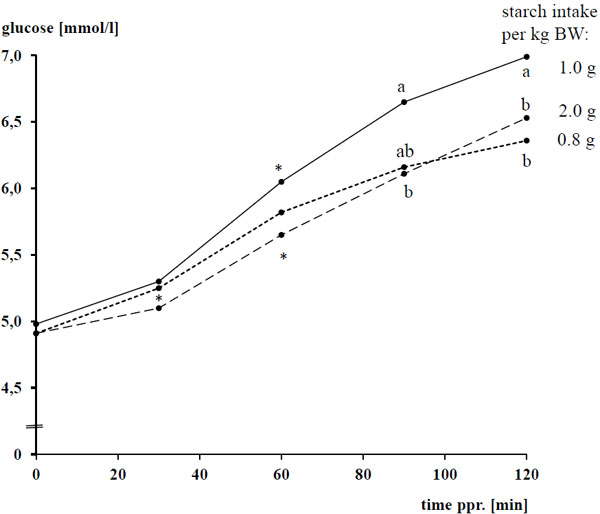
Fig. (2)
Mean plasma glucose following the ingestion of 0.8, 1 and 2 g starch/kg BW and meal, respectively (The means represent the average over crushed oats and barley and cracked maize, in each case for 4 horses x 3 measurements.; pooled SD = ± 0.538; a, b indicate with P < 0.05 significant differences of means between the individual types of cereal grains within a given time point. Asterisks indicate the time point at which the respective mean was for the first time significantly different from the basal level).