- Home
- About Journals
-
Information for Authors/ReviewersEditorial Policies
Publication Fee
Publication Cycle - Process Flowchart
Online Manuscript Submission and Tracking System
Publishing Ethics and Rectitude
Authorship
Author Benefits
Reviewer Guidelines
Guest Editor Guidelines
Peer Review Workflow
Quick Track Option
Copyediting Services
Bentham Open Membership
Bentham Open Advisory Board
Archiving Policies
Fabricating and Stating False Information
Post Publication Discussions and Corrections
Editorial Management
Advertise With Us
Funding Agencies
Rate List
Kudos
General FAQs
Special Fee Waivers and Discounts
- Contact
- Help
- About Us
- Search


The Open Nutrition Journal
(Discontinued)
ISSN: 1874-2882 ― Volume 15, 2021
Effect of Macronutrient on Plasma, Liver and Pancreatic Metabolomics and their Hierarchic Weights in the Metabolic Network
József Szabo1, *, Geza Bruckner2, Laszlo Koranyi3, Norbert Solymosi4, G. Mitchell5
Abstract
Background/Aims:
The aims of this study were to: 1) investigate the specific metabolomic effects of single macro nutrients in cold exposed rats; and 2) Using centrality analysis ascertain the correlations between these metabolomic parameter measurements.
Methods:
Fifty male Wistar rats were divided into 5 groups and individually housed under cold climatic conditions. Rats were either cold exposed fasted (negative control) or fed with the following commercially available single macronutrients: casein, POLYCOSE® and safflower oil; the positive control diets included all macronutrients. Samples from the plasma, liver and pancreas were collected and 33 different parameters were determined.
Results:
The primary correlation found between pancreatic hormones and the variables as measured, showed significant positive connections between centrality network node members. Heatmap analysis showed that the macronutrients fed have very differing effects on the metabolomics measured, i.e. casein has a high Heatmap Index on plasma corticosterone while POLYCOSE® and fat had a minimal impact.
Conclusion:
The cold exposed fasted animal model, in which nutrient catabolism is near maximal, serves as a useful “in vivo” tool for studying the relationships among the nutrients, hormones and digestive enzymes under cold stress conditions; feed intake, liver glucose, and small intestinal amylase hold a high position in centrality mapping and are highly imbedded in the metabolomic networks. For example, this model shed light on the relations amoung hormone and enzyme contents of duodenal pancreas, gastric+splenic pancreas and enzyme activities in small intestinal contents. These findings can be applied to optimizing feeding of animals under cold stress.
Article Information

Identifiers and Pagination:
Year: 2018Volume: 12
First Page: 40
Last Page: 58
Publisher Id: TONUTRJ-12-40
DOI: 10.2174/1874288201812010040
Article History:
Received Date: 28/3/2018Revision Received Date: 14/8/2018
Acceptance Date: 16/8/2018
Electronic publication date: 31/08/2018
Collection year: 2018
open-access license: This is an open access article distributed under the terms of the Creative Commons Attribution 4.0 International Public License (CC-BY 4.0), a copy of which is available at: https://creativecommons.org/licenses/by/4.0/legalcode. This license permits unrestricted use, distribution, and reproduction in any medium, provided the original author and source are credited.
* Address correspondence to the author at the Institute of Animal Breeding, Nutrition and Laboratory Animal Science, University of Veterinary Medicine, Budapest, István u. 2, 1078, Hungary; Tel: 3614784100; E-mail: szabo.jozsef@univer.hu
| Open Peer Review Details | |||
|---|---|---|---|
| Manuscript submitted on 28-3-2018 |
Original Manuscript | Effect of Macronutrient on Plasma, Liver and Pancreatic Metabolomics and their Hierarchic Weights in the Metabolic Network | |
1. INTRODUCTION
1.1. Cold Exposed Fasted (CEF) and Cold Exposed Balanced Diet Fed (CEBDF) Animal Models
To study the relationships among the nutrients, hormones and digestive enzymes in an “in vivo” model, we used a CEF (cold exposed fasted; negative control) and a CEBDF (cold exposed balanced diet fed; positive control) animal model based on our earlier study [1Szabo J, Fodor E, Korányi L, Bruckner G. Effect of nutrients on plasma corticosteroid concentration in cold-stressed rats. Ann Nutr Metab 1993; 37(2): 53-61.
[http://dx.doi.org/10.1159/000177750] [PMID: 8517634] ]. We hypothesized that in this cold exposed metabolic model the rats on the positive CEBDF ad libitum would be in zero energy balance while the negative CEF control animals were in maximum negative energy balance. Therefore, if rats were fed specific single macronutrients, the weight loss would be between these two values and reflective of overall energy balance.
Further, we recognized that a comparison of the effect(s) of a single fed macronutrient to that of a well-balanced positive control diet can be misleading because the observed differences in metabolic changes may not only be due to the direct influence of the single macronutrient fed but also due to the lack of other macro-nutrient(s) present in the balanced diet.
In the fasted animals, the energy and nutrients necessary for the maintenance of homeostasis are mobilized from the energy and amino acid stores of the animals. Feeding a single nutrient will change this mobilization according to the energy and nutritional value of the administered nutrient. The levels of metabolic regulatory hormones and associated metabolites are therefore modified according to the specific administered macronutrient. This metabolic model may give us new insights into how specific nutrients or combinations of nutrients may regulate metabolic homeostatic mechanisms under hypothermic stress conditions.
1.2. Pancreas Structure/Function
Since the pancreas is a “digestive and energy regulator” it was a primary focus of this study to determine how macronutrients affect metabolomic parameters in a CEF animal model. The histological description of the pancreas divides this organ into two different glands, the endocrine islets of Langerhans and the exocrine acini. Henderson [2Henderson JR. Why are the islets of Langerhans? Lancet 1969; 2(7618): 469-70.
[http://dx.doi.org/10.1016/S0140-6736(69)90171-8] [PMID: 4183910] ] hypothesized that pancreatic islet hormones play a central role in the regulation of exocrine pancreatic function through metabolic control of the exocrine gland. Subsequently the studies of the microvasculature of the pancreas revealed that “all mammalian species probably have direct arteriolar flow to both islets and acini, direct venous drainage from large islets, and an insulo-acinar portal system mainly from small islets; it is also probable that species vary in the proportions of these options” [3Bonner-Weir S. The microcirculature of the pancreas, with emphasis on that of islets of Langerhans. Anatomy and functional implications.The Pancreas: Biology, Pathobiology, and Disease 2nd ed. 1993; 759-68.]. These studies suggest that the microvasculature of the pancreas makes possible both the local endocrine and paracrine control of exocrine pancreas by regulation of the high concentrations of islet hormones and also that the islet hormones reach the acinar cells through the systemic blood circulation in much lower concentrations and thereby exert their effect on the acinar tissue. Another circumstance complicating the understanding of the relationships between the endocrine and exocrine pancreatic function is the difference in the histological structure of Langerhans islets in the Gastric+Splenic Pancreas (GSP) and Duodenal Parts (DP) of the organ. “Two types of islets were identified, a Pancreatic Polypeptide (PP)-rich islet, characteristic of lower duodenal region, and a glucagon-rich islet, characteristic of the upper duodenal, gastric and splenic regions” [4Elayat A A, El-naggar M M, Tahir M. An immunocytochemical and morphometric study of the rat pancreatic islets. 1995; 186: 629-37.].
Production and secretion of pancreatic hydrolases are not only influenced by diet composition [5Grossman MI, Greengard H, Ivy AC. The effect of dietary composition on pancreatic enzymes. Am J Physiol 1942-43; 138: 672-82.-7Szabó J, Ribiczey P, Fodor E, Tenk I. Influence of environmental factors on digestive enzymes and plasma corticosterone in rats. I. Diet. Acta Vet Acad Sci Hung 1981; 29(4): 399-422.
[PMID: 7053015] ] but also by other environmental factors, such as the ambient temperature [8Szabó J, Ribiczey P, Fodor E, Tenk I. Influence of environmental factors on digestive enzymes and plasma corticosterone in rats. II. Ambient temperature. Acta Vet Acad Sci Hung 1981; 29(4): 423-35.
[PMID: 7053016] ]and atmospheric pressure [9Szabó J, Ribiczey P, Fodor É, Tenk I. Influence of environmental factors on digestive enzymes and plasma corticosterone in rats. III. Atmospheric pressure. Acta Vet Acad Sci Hung 1981; 29: 437-40.
[PMID: 6764086] ]. Therefore, both the diet and the metabolic status of the animal play important roles in the control of the exocrine pancreatic function.
1.3. Hypothesis
To better understand these interrelationships, we hypothesize that Cold Exposure (CE) and diet alter the insulin, glucagon and pancreatic polypeptide concentrations, and ratios, in the blood and pancreatic tissue, as well as the digestive enzyme production in the pancreatic acini and enzyme activity in the small intestinal content. We also hypothesized that single nutrient diets, e.g. POLYCOSE® (a glucose polymer) and casein (a good gluconeogenic substrate) will stimulate insulin secretion, while the safflower-oil (ketogenic substrate) and fasting will inhibit insulin and stimulate glucagon secretions and these metabolic differences would reflect in the function of the exocrine pancreas.
2. MATERIALS AND METHODS
2.1. Animals and Diets
Fifty male Wistar rats, weighing 300-400 g (avg. 347.7±24.2 g) were divided into 5 groups, comprising groups with similar average starting body weights. Animals were individually housed in wire-bottom cages [light cycle 12 h on (7 a.m. – 7 p.m.) 12 h off (7 p.m. – 7 a.m.)], under hypothermic climatic conditions (10±2oC, 70±5% relative humidity).
Four groups were fed the experimental diets ad libitum for 72 hours while the 5th group was fasted for the same period. The composition of the diets is shown in Table 1.
Drinking water was supplied ad libitum. Commercially available casein, POLYCOSE®, and safflower oil were used for the unbalanced single macronutrient diets as well as combined in the CEBDF (control) diets. Because of the short experimental period, vitamins and minerals were not considered limiting and therefore were not supplemented in any of the diets.
The Body Weights (BW) of the rats were recorded at 0 and after 72 h on the various dietary regimens. To minimize the effect of diurnal rhythms, the rats were sacrificed after 72 h cold stress via sodium pentobarbital anesthesia (35 mg/Kg bwt) and exsanguinated via the vena cava caudalis between 8 and 10 a.m. following a sequence that randomized the treatment groups. The University of Kentucky IACUC approved the protocol.
2.2. Samples for Analysis
2.2.1. Blood-Plasma-Serum
- Samples for blood, plasma and serum were collected in glass tubes (heparinized for plasma) kept on ice, and then centrifuged (4oC, 10 min, 2,000 rpm) to obtain the plasma or serum fraction.
2.2.2. Glucose (Blood and Liver Homogenates)
-
Determined using GLUCO GOD/POD/PAP Test of Galenopharm according to Trinder for the determination of the glucose concentration of blood [10Trinder P. Determination of blood glucose using an oxidase-peroxidase system with a non-carcinogenic chromogen. J Clin Pathol 1969; 22(2): 158-61.
[http://dx.doi.org/10.1136/jcp.22.2.158] [PMID: 5776547] ].
2.2.3. Triglyceride and FFA
-
Triglyceride concentrations of serum and liver homogenates were tested by the colorimetric assay of Biggs et al. [11Biggs HG, Erikson JM, Moorehead WR. A manual colormetric assay of triglycerides in serum. Clin Chem 1975; 21(3): 437-41.
[PMID: 1112059] ]. Duncombe’s [12Duncombe WG. The colorimetric micro-determination of long-chain fatty acids. Biochem J 1963; 88(1): 7-10.
[http://dx.doi.org/10.1042/bj0880007] [PMID: 16749030] ] colorimetric test was used for the determination of FFA contents of the same samples.
2.2.4. Corticosterone
-
Concentration of plasma was determined using Murphy’s Competitive Protein Binding Assay [13Murphy BEP. Some studies of the protein-binding of steroids and their application to the routine micro and ultramicro measurement of various steroids in body fluids by competitive protein-binding radioassay. J Clin Endocrinol Metab 1967; 27(7): 973-90.
[http://dx.doi.org/10.1210/jcem-27-7-973] [PMID: 4291524] ], with an inter-assay coefficient of variance of 2%.
2.2.5. Liver
- The liver samples were stored in tightly wrapped aluminum foil, frozen immediately in liquid nitrogen and stored at -70oC until analyzed. Prior to analysis the samples were thawed on ice, homogenized in 3.0 ml of cold Sorensen-phosphate buffer (pH 7.4, 0.15 mol).
2.2.7. Liver Glucose and Glycogen
-
Samples were assayed by the method of Good at al. [15Good CA, Kramer H, Somogyi M. The determination of glycogen. J Biol Chem 1933; 100: 485-91.], and by Trinder’s method [16Trinder P. Determination of blood glucose using an oxidase-peroxidase system with a non-carcinogenic chromogen. J Clin Pathol 1969; 22(2): 158-61.
[http://dx.doi.org/10.1136/jcp.22.2.158] [PMID: 5776547] ].
2.2.8. Pancreatic Tissues
-
The Lower+upper Duodenal (DP) and Gastric+Splenic (GSP) Pancreatic lobes were separeted (Fig. 1
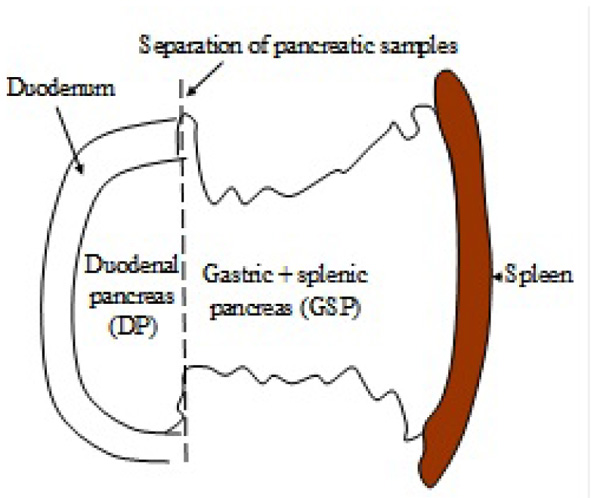 ) and homogenized with Potter-Elvehjem homogenizer in ice-cold saline. The homogenized samples were centrifuged (4 oC, 10 min, 2,000 rpm) and the supernatants were stored at -70o C until further analysis.
 |
Fig. (1) Diagrammatic presentation of the separation of the Duodenal (DP) and Gastric+Splenic (GSP) Pancreatic regions. |
2.2.9. RNA and Proinsulin-1 mRNA
- Pancreatic tissue was excised from the GSP tissue near the spleen and immediately homogenized in a stop solution. Pancreatic RNA was prepared by standard guanidiumthiocyanate/phenol/ethanol extraction and proinsulin-1 mRNA was determined by Northern blotting [17Sambrook J, Frittsch EF, Maniatis T. Molecular Cloning. Laboratory Manual. Cold Spring Harbor Laboratory, 1989 New York].
2.2.10. Pancreatic Polypeptide (PP)
-
Plasma and pancreas tissue PP concentrations were determined as described by Gettys et al. [18Tom W. Gettys, Richard Garcia, Karin Savage, David C. Whitcomb, Shuji Kanayama, and Ian L. Taylor insulin-sparing effects of pancreatic polypeptide in congenitally obese rodents. PancreasVol 1991; 6(1): 46-53.
[http://dx.doi.org/10.1097/00006676-199101000-00007] ].
2.2.11. Insulin and Glucagon
Pancreatic insulin and glucagon concentrations were tested following acid ethanol extracts (0.18N HCl; 75% ethanol) of the homogenized pancreatic tissue.
The insulin concentrations of plasma and tissue extracts were determined by R-2 RIA Kit (MTA, Hungary) using rat insulin standard (Novo, Denmark). The sensitivity of the RIA procedure was 35±16pmol/l. The inter-assay coefficient of variance was 8.3%.
The glucagon concentrations of plasma and tissue extract were determined by RIA, using C-terminal specific antibodies [19 Phedebas Amylase Tests, Pharmacea Diagnostics AB, Upsala, Sweden]. The sensitivity of the assay was 3.6±1.2 pmol/l. The inter-assay coefficient of variance was 7.3%.
2.2.12. Small Intestinal Contents (SIC)
The small intestinal contents were diluted with distilled water and the samples were centrifuged (4oC, 10 min, 2,000 rpm) and the supernatants stored at -70oC until the test of the hydrolases.
2.2.13. Hydrolase Activities of the Pancreas Homogenates and SIC
Amylase [19 Phedebas Amylase Tests, Pharmacea Diagnostics AB, Upsala, Sweden], lipase [20Schön H, Rassler B, Henning N. Über die untersuchung der exretorischen pancreasfunction. Methoden zur activatsbestimmung von Trypsin, chymotrypsin, carboxipeptidase, lipase und diastase. Klin Wochenschr 1961; 39: 217-22.
[PMID: 13748352] ] and trypsin [21Szabó J, Ribiczey P, Fodor E, Tenk I. Influence of environmental factors on digestive enzymes and plasma corticosterone in rats. I. Diet. Acta Vet Acad Sci Hung 1981; 29(4): 399-422.
[PMID: 7053015] ] activities were tested as previously described. For the trypsin test the pancreas proteolytic zymogens of the samples were activated by enterokinase (Sigma Chemical Co., Louis, MO, USA) at 37oC for 60 min in Na-citrate buffer (pH 5.6) and the trypsin activity was determined photometrically using Boehringer colorimetric test-combination (Cat. No.125024).
2.3. Statistical Analysis
Statistical analyses were performed using SPSS version 18.0 (IBM SPSS Statistics, IBM Corporation, Armonk, New York) [22 IBM SPSS Statistics version 18.0 (IBM SPSS Statistics, IBM Corporation, Armonk, New York). https:// www.calstatela.edu/ sites/default/ files/groups/ Information%20Technology% 20Services/training/ pdf/spss23p3.pdf], which included ANOVA followed by post hoc LSD and polynomial regression analysis.
In the presented networks the nodes are the variables. The networks were built based on the correlation of the parameters. All parameter pairs were correlated and the statistic was tested [23Myles Hollander & Douglas A. Wolfe. Nonparametric Statistical Methods 1973.]. Below the p<0.05 threshold, we handled the variables as connected independently by the correlation direction. These connections are represented by edges in the graphs. These analysis was performed by using the R-environment [24 The R Project for Statistical Computing (R Core Team (2016). R: A language and environment for statistical computing. R Foundation for Statistical Computing, Vienna, Austria. URL https://www.R-project.org] (R: A language and environment for statistical computing).
Centrality (the weight of nodes) was analyzed by the yEd Graph Editor [25 yEd Graph Editor https://www.yworks.com/products/yed]. In network science, centrality is a measure of the importance of the nodes composing the network. Centrality is a count of the number of connections a network member has to the other members of the network. It is often thought that a member with a high number of connections holds a central position by being highly embedded in the network. Centrality is measured on a scale of 0 to 1 (depending on the integers of correlation coefficients), with those scores closest to 1 being the most central actors in the network. In our network, those measured parameters with higher centrality scores are more interconnected with the larger network of metabolomic compounds that effect x.
The heatmap was generated by the R-package pheatmap [26Kolde R. 2018. pheatmap: Pretty Heatmaps. R package version 1.0.10. https:// CRAN.R-project.org/ package=pheatmap].
3. RESULTS AND DISCUSSION
3.1. Effect of Macronutrients vs Fasting on Feed (energy) Intake and Body Weight Changes in a CE Animal Model
It is generally accepted that the daily feed intake of rats is primarily controlled by their energy requirements [27Alhaidary A, Mohamed HE, Beynen AC. Differences between rats and rabits in their response of feed and energy intake to increasing dietary fat content. Scand J Lab Anim Sci 2010; 37: 237-40.]. However several circulating peptides and steroids influence appetite through their effects on the hypothalamus, brain stem and autonomic nerve system and the hormones come from fat cells, the gastrointestinal tract and the pancreas [28Coll AP, Farooqi IS, O’Rahilly S. The hormonal control of food intake. Cell 2007; 129(2): 251-62.
[http://dx.doi.org/10.1016/j.cell.2007.04.001] [PMID: 17448988] ].
The data depicted in Table 2 show that the daily feed intake of CEBDF positive control rats was 7.93g/100g BW. Since the BW of rats in this group did not change significantly (0.1±0.32 g/100g bwt.), it can be concluded that the feed intake covered the maintenance energy and amino acid requirements of the rats in the hypothermic environment.
During the same time period the negative control CEF rats lost 6.82 g/100g BW. On the basis of these measures (7.93 g feed intake of the positive control rats versus 6.82 g bwt loss in the negative fasted group), it is apparent that 7.93 g feed intake prevented 6.82 g BW loss in the positive control group; therefore, 1.15 g balanced diet was required for the prevention of one g BW loss in this hypothermic environment. The Gross Energy (GE) intake in the positive control group used for the prevention of 1 g BW loss was 4.89 kcal/100g BW/day.
Using the same calculations for the POLYCOSE® fed group, where the daily POLYCOSE® intake and the BW loss were 8.15 and 1.39 g respectively, indicates that 5.53 grams of BW loss were prevented by 8.15 g carbohydrate intake (1.47 g POLYCOSE® prevented 1 g BW loss). The GE intake used for the prevention of 1g BW loss was equivalent to 5.89 kcal. The rats on the casein diet consumed 2.67 g/day/100g BW, which prevented 2.58 g BW loss. Consequently 1 g BW loss was prevented by 1.05 g casein. The GE intake for the prevention of 1 g BW loss was equivalent to 4.20 kcal. The intake of safflower oil (1.27 g/day/100 g BW) prevented 2.82 g BW loss. One gram BW loss was prevented by 0.45 g safflower oil. The GE intake was 4.42 kcal to prevent 1g of BW loss.
On the basis of the results of feed intake and BW changes, it is apparent that a single macronutrient intake was inadequate for maintaining the BW of the rats even with ad libitum consumption. The feed and energy intake of POLYCOSE® fed group was not reduced compared to CEBDF positive control rats but still resulted in a significant daily BW loss.
Casein and safflower-oil reduced the feed and energy intake of the rats and resulted in significantly more daily BW loss (4.24 and 4.00 g/100g BW respectively). The energy intake from casein and safflower-oil were almost identical (10.7 and 11.4 kcal/100 g BW/day) and it is not surprising, that the energy intake of the rats in the different treatment groups and the change of BW showed a significant linear correlation (R=0.978; p=0.004) (Fig. 2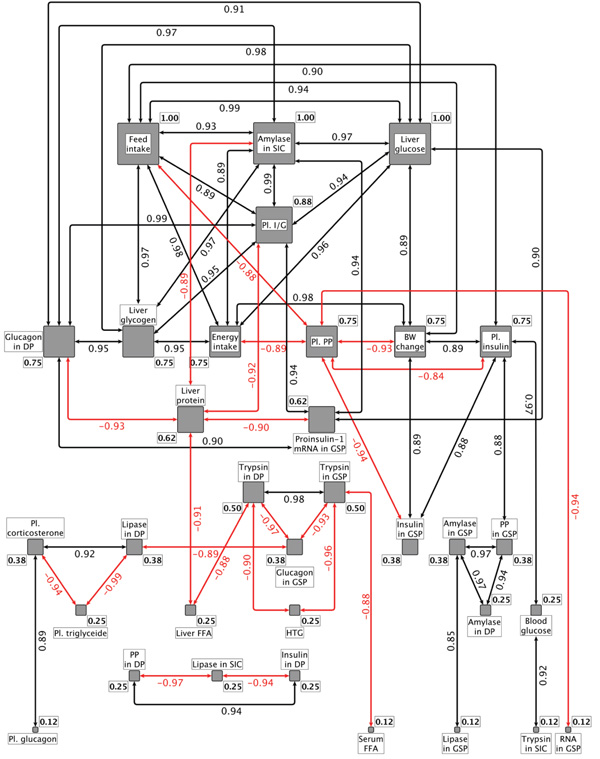 ).
).

Although a clear mechanism for the reduced nutrient (energy) intake of the rats on casein and safflower oil is not evident, it might be due to the feed intake reducing effect of a high protein diet (more than 30%) [29Mercer P L, Watson D F, Ramlet J S. Control of food intake in the rat by dietary protein concentration. J Nutr 1981; 111: 1117-23.] and to the possible increase in ketone bodies (not measured) in the safflower oil fed group. Greenman et al. [30Greenman Y, Golani N, Gilad S, Yaron M, Limor R, Stern N. Ghrelin secretion is modulated in a nutrient- and gender-specific manner. Clin Endocrinol (Oxf) 2004; 60(3): 382-8.
[http://dx.doi.org/10.1111/j.1365-2265.2004.01993.x] [PMID: 15009005] ] have shown that similar to a glucose load, ghrelin levels decreased significantly following a lipid meal while protein intake did not affect ghrelin levels suggesting that hormonal appetite regulation may be a factor, but likely due to differing mechanisms for lipids versus protein metabolism.
3.2. Effect of Nutrients on Blood Glucose, Plasma Triglyceride, and Serum FFA in a CE Animal Model
To ensure that animals were in an absorptive state, stomach contents were checked following exsangination of the animals. All animals had residual stomach contents of the macronutrients fed indicating that they were in an absortive state.
3.2.1. Blood Glucose
The blood glucose levels (Table 3) of the following 3 groups were significantly different from each other: 1. CEBDF positive control (7.16±0.57 mM/l), 2. POLYCOSE® (6.27± 0.25 mM/l), and Casein diets (6.15±0.66 mM/l), 3. Safflower oil and the negative CEF control group (4,76±0.46 mM/l; 5,31±0.70 mM/l). All of these values were inside the normal clinical range for fasted and fed rats, e.g. “the average fasted and fed postprandial glucose level of normal Wistar rats was 3.95 ± 1.31 mM/l and 5.65 ± 1.63 mM/l; the 95% upper limit was 6.2 mM/L and 7.9 mM/L respectively” [31 Wang, Yang Y, Xiang X, Zhu Y, Men J, He M. Estimation of the normal range of blood glucose in rats. 2010. Wei Sheng Yan Jiu. 2010; 39(2):133-7, 142. [Article in Chinese]].
3.2.2. Plasma Triglycerides
According to Byers and Friedman [32Byers SO, Friedman M. Site of origin of plasma triglyceride. Am J Physiol 1960; 198: 629-31.
[http://dx.doi.org/10.1152/ajplegacy.1960.198.3.629] [PMID: 13806614] ] the liver is the major source of plasma triglyceride. In our CEF animal model fasting and the feeding of casein as a single nutrient, resulted in significantly smaller triglyceride levels then it was in the other treatment groups (Table 3). Higher triglyceride concentrations were detected in rats fed POLYCOSE®, safflower oil and the CEBDF diets.
Contrary to our results, Ettinger et al. [33Ettinger WH, Klinefelter HF, Kwiterovitch PO. Effect of short-term, low-dose corticosteroids on plasma lipoprotein lipids. Atherosclerosis 1987; 63(2-3): 167-72.
[http://dx.doi.org/10.1016/0021-9150(87)90117-1] [PMID: 3493784] ] reported that low-doses of corticosteroids markedly increased the LDL cholesterol, and triglycerides but not the HDL cholesterol level.
Since the triglyceride concentration of plasma is an important risk factor for cardiovascular disorders, our data show that casein as a single nutrient may have beneficial effects, however this effect also can be the result of the lack of lipids and carbohydrates from the diet of the casein fed group.
3.2.3. Serum FFA
Serum FFAs (Table 3) are mobilized from the adipose and peripheral tissues and utilized by the liver, muscle, myocardium and other tissues [34Gordon RS Jr. Unesterified fatty acid in human blood plasma. II. The transport function of unesterified fatty acid. J Clin Invest 1957; 36(6 Part 1): 810-5.
[http://dx.doi.org/10.1172/JCI103486] [PMID: 13439020] ]. It is generally believed that elevated plasma FFAs play significant role in the pathogenesis of insulin resistance [35Roden M, Price TB, Perseghin G, et al. Mechanism of free fatty acid-induced insulin resistance in humans. J Clin Invest 1996; 97(12): 2859-65.
[http://dx.doi.org/10.1172/JCI118742] [PMID: 8675698] ].
In our CEF animal model, only the safflower oil increased significantly the serum FFA levels above the values found in the other treatment groups (Table 3).
It is interesting that the serum FFA level of CEF and CEBDF animals were practically identical. Because in the CEBDF the plasma insulin level was very high, we may assume that there was no FFA mobilization and catabolic amino acid disposal was minimal. This suggests that contrary to the fasted rats, the plasma FFA of CEBDF rats did not come from the lipid stores, but because the animals were in an absorptive metabolic state, FFA more likely originated from the safflower oil content of the diet and from FFA synthetized by the liver from the absorbed glucose. This assumption is supported by calculating the plasma FFA level of the dietary treatment groups. The control diet contained 75% polycose and 5% safflower oil. Adding up the 75% of the serum FFA (0.41 mM/l) of POLYCOSE® group (0.55 mM/l) and 5% of the serum FFA (0.04 mM/l) of safflower group (0.87 mM/l), we arrive at almost exactly the serum FFA (0.46 mM/l) concentration of CEBDF rats (0.47 mM/l).
We conclude that in the CEF animal model the blood glucose level remained in the clinically acceptable range. Among the tested 33 parameters the blood glucose showed correlation only with the insulin level of plasma (Fig. 2). The plasma triglyceride negatively correlated with plasma corticosterone and the lipase content of DP tissue. The significant correlations between the plasma triglyceride and corticosterone concentrations may have importance regarding the acute phase response during stress and is in accord with the observation of Chait et al. [36Chait A, Brunzell JD, Johnson DG, et al. Reduction of plasma triglyceride concentration by acute stress in man. Metabolism 1979; 28(5): 553-61.
[http://dx.doi.org/10.1016/0026-0495(79)90197-5] [PMID: 221783] ]; they found that different forms of stress resulted in acute reduction of plasma triglyceride concentrations. The serum FFA was significantly increased only by the safflower oil diet. The correlation analysis (Fig. 2) indicates significant negative relation of serum FFA to the trypsinogen content of the GSP (r=-0.878 p=0.050).
The clear understandings of the clinical significance of these correlations needs further investigation.
3.3. Effect of Macronutrients on Liver protein, Triglyceride, FFA, Glucose and Glycogen in a Cold Exposed Animal Model
3.3.1. Liver (Hepatic) Protein
The highest liver protein concentration (Table 4) was in the fasted and the casein fed groups. The lowest level was in the polycose fed rats. The liver protein showed negative relationships with the I/G ration of plasma (r=-0.917 p=0.028), liver FFA (r=-0.910 p=0.032), proinsulin-1 mRNA in GSP (r=-0.900 p=0.032), glucagon in the DP tissue (r=-0.932 p=0.021) and amylase activity in the small intestinal content (r= 0.894 p=0.041) (Fig. 2).
3.3.2. Liver (Hepatic) Triglyceride
According to Delgado et al. [37Delgado TC, Pinheiro D, Caldeira M, et al. Sources of hepatic triglyceride accumulation during high-fat feeding in the healthy rat. NMR Biomed 2009; 22(3): 310-7.
[http://dx.doi.org/10.1002/nbm.1327] [PMID: 19012281] ], the Hepatic Triglyceride (HTG) concentrations are influenced by dietary lipid concentrations in healthy rats, although the de novo lipogenesis contribution to HTG content is suppressed by a high-fat diet. This effect is insufficient to prevent overall increases in HTG concentrations.
In our CEF animal model the safflower oil and the POLYCOSE® feeding resulted in significantly higher HTG concentrations (Table 4) than it was in the fasted, casein and CEBDF groups.
This effect of safflower oil is in accord with the result of Neschen et al. [38Neschen S, Moore I, Regittnig W, et al. Contrasting effects of fish oil and safflower oil on hepatic peroxisomal and tissue lipid content. Am J Physiol Endocrinol Metab 2002; 282(2): E395-401.
[http://dx.doi.org/10.1152/ajpendo.00414.2001] [PMID: 11788372] ]. In accordance with the high plasma insulin concentration, POLYCOSE® appears to have stimulated the de novo HTG synthesis. In the control group where safflower oil, POLYCOSE® and casein were included in the diet the HTG concentration was significantly lower (87.9±22.8 mg/g protein) than either in rats on the safflower oil or POLYCOSE® diets, suggesting that the lipid accumulation in the liver is suppressed by casein.
This suggests that the presence or absence of casein, a high quality protein source, may be an important factor in the lipid VLDL transport from the liver to the peripheral tissues, likely through changes in lipoprotein synthesis and transport. This speculation is in accordance with results of Pfueuffer and Barth [39Pfeuffer M, Barth CA. Modulation of very low-density lipoprotein secretion by dietary protein is age-dependent in rats. Ann Nutr Metab 1986; 30(5): 281-8.
[http://dx.doi.org/10.1159/000177205] [PMID: 3752927] ], that dietary casein may increase the influx of lipoprotein cholesterol and triglycerides into the plasma compartment. The triglyceride content of liver was in negative correlation with the trypsinogen content of DP (r=-0.902 p=0.036) and GSP (r=-0.963 p=0.009) tissues (Fig. 2). These relationships are unclear and need further investigation.
3.3.3. Liver (Hepatic) Free Fatty Acid
The liver FFA may originates from three sources: from the FFA content of the circulating blood, the chylomicron remnant uptake and the de novo lipogenesis in the liver [40Mashek DG. Hepatic fatty acid trafficking: multiple forks in the road. Adv Nutr 2013; 4(6): 697-710.
[http://dx.doi.org/10.3945/an.113.004648] [PMID: 24228201] ]. In addition to these three, intracellular pathways, triglyceride hydrolysis may also contribute to the FFA concentration in the liver.
Relative to the CEF negative control group, each diet increased the FFA content of the liver (Table 4). The POLYCOSE® doubled the liver FFA level, suggesting that the de novo lipid synthesis from absorbed glucose is significant.
The second most effective FFA stimulator was the safflower oil. This may be the result of increased liver chylomicron remnant uptake due to lymphatic transport of safflower oil into the systemic circulation. The increasing effect of casein on the liver FFA is only 19% suggesting that a smaller proportion of the absorbed amino acids were used for lipid synthesis. Compared to the CEBDF control, POLYCOSE® increased while casein and fasting decreased significantly the liver FFA concentration (Table 4, Fig. 3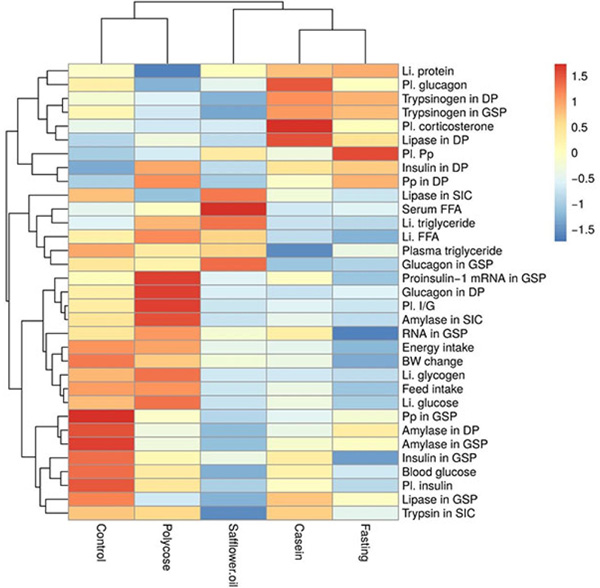 ). There were negative correlations between the liver protein and liver FFA, and the trypsinogen contents of both pancreatic lobes (Fig. 2).

Between the FFA and triglyceride contents of liver a polynomial relationship can be detected (y= -0.0095x2 + 3.152x-81.51; R2 = 0.968), where y represents the FFA and x is for triglyceride suggesting that the real relationship between the liver FFA and triglyceride levels is not linear (Fig. 4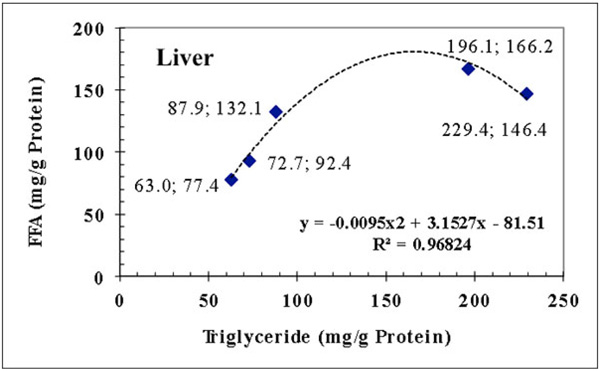 ).
).
 |
Fig. (4) Polynomial relationship between the triglyceride and FFA concentrations of liver. |
3.3.4. Liver Glucose and Glycogen
Feeding POLYCOSE® and the CEBDF diets induced the highest liver glucose and glycogen concentrations (liver glucose: 208.0±20.1, 247.2±26.5; glycogen: 68.3±44.2, 88.1± 44.0 mg/g protein respectively) but there were no significant differences in liver glycogen among the casein, safflower oil and fasted (5.7± 3.2, 6.6±1.8, 4.0±0.7, 1.0±0.9 mg/g protein respectively) groups (Table 4). Among the tested 33 parameters the feed intake, energy intake, plasma I/G, small intestinal amylase activity and glucagon in the DP tissue correlated positively and significantly with the glucose and glycogen contents of liver (Fig. 2).
3.4. Effect of Macronutrients on Hormone Concentrations of Plasma in the CE Model
3.4.1. Plasma Insulin
Compared to the negative CEF control animals, the CEBDF positive control, the casein and the POLYCOSE® diets significantly increased the plasma insulin concentration (Table 5, Fig. 4). The safflower oil depressed the plasma insulin level, but this difference (-29%) was not statistically significant.
Plasma insulin positively correlated with feed intake (r=0.899; p=0.038), bodyweight change (R=0.887; p=0.044), blood glucose (r=0.970; p=0.006) and negatively to plasma PP (r=-0.840; p=0.075) concentration (Fig. 2), however polynomial regression analysis shows Fig. (5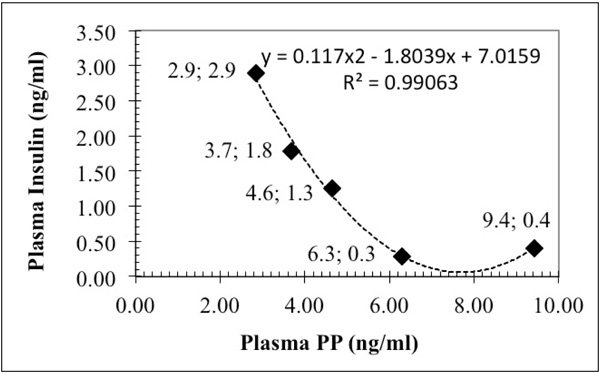 ) very close relation between plasma insulin and PP (R2=0.991), suggesting that plasma PP is the negative partner of insulin in the control mechanism/s of metabolism.
 |
Fig. (5) There is a highly significant polynomial relationship between plasma insulin and PP. |
It is interesting that the insulin and glucagon levels of plasma did not show significant relationship with each other. This result is in agreement with the suggestion of Gerich at al [41Gerich JE, Charles MA, Grodsky GM. Characterization of the effects of arginine and glucose on glucagon and insulin release from the perfused rat pancreas. J Clin Invest 1974; 54(4): 833-41.
[http://dx.doi.org/10.1172/JCI107823] [PMID: 4430717] ]. that ”endogenous insulin per se has little or no effect on Immunoreactive Glucagon (IRG) secretion and that endogenous glucagon does not appreciably affect pancreatic beta cell function”.
On the basis of these data, it is clear that both the casein and POLYCOSE® diets stimulated the insulin secretion significantly and safflower oil slightly but not significantly depressed it (-29%). These data are in agreement with the results of Gerich at al. [42Gerich JE, Charles MA, Grodsky GM. Characterization of the effects of arginine and glucose on glucagon and insulin release from the perfused rat pancreas. J Clin Invest 1974; 54(4): 833-41.
[http://dx.doi.org/10.1172/JCI107823] [PMID: 4430717] ], that both arginine and glucose alone and in combination with each other stimulated the insulin secretion of pancreas probably through different mechanisms. The 29% decrease (relative to CEF) of insulin concentration in the safflower oil fed group may be due to prolonged high plasma FFA concentrations, which may inhibit insulin secretion. This is in agreement with the result of Kashyap et al. [43Kashyap S, Belfort R, Gastaldelli A, et al. A sustained increase in plasma free fatty acids impairs insulin secretion in nondiabetic subjects genetically predisposed to develop type 2 diabetes. Diabetes 2003; 52(10): 2461-74.
[http://dx.doi.org/10.2337/diabetes.52.10.2461] [PMID: 14514628] ] that prolonged lipid exposure impairs beta cell function in both in vitro and in vivo animal studies.
To be noted, when the plasma insulin level of CEF rats (0.41 ng/ml) is deducted from the sum of the plasma insulin in the single nutrient groups (casein 1.26 + POLYCOSE® 1.79 + safflower oil 0.29 = 3.34 ng/ml), we get almost exactly the insulin concentration (3.34 - 0.41 = 2.93) observed in rats on the CEBDF positive control diet (2.90), suggesting that the combined effect of casein (amino acids), POLYCOSE® (glucose) and safflower oil on insulin secretion of the pancreas is possibly cumulative but not synergistic.
3.4.2. Plasma Glucagon
Our better understanding of how nutrients affect glucagon secretion was brought to light in the 1970s when Unger et al. [44Unger RH, Eisentraut AM, McCall MS, Keller S, Lanz HC, Madison LL. Glucagon antibodies and their use for immunoassay for glucagon. Proc Soc Exp Biol Med 1959; 102(10): 621-3. 3
[http://dx.doi.org/10.3181/00379727-102-25338] ] developed a specific glucagon radioimmunoassay. It is generally accepted that glucose has a direct inhibitory effect on alpha cells [45Vieira E, Salehi A, Gylfe E. Glucose inhibits glucagon secretion by a direct effect on mouse pancreatic alpha cells. Diabetologia 2007; 50(2): 370-9.
[http://dx.doi.org/10.1007/s00125-006-0511-1] [PMID: 17136393] ] and protein (soybean and casein) rich diet increase the arginine stimulated glucagon secretion [46Noseda G, Fragiacomo C, Gatti E, Descovich G, Sirtori CR. Glucagon release following experimental diets in man: effects of soybean and casein enriched diets. Pharmacol Res Commun 1982; 14(9): 867-78.
[http://dx.doi.org/10.1016/S0031-6989(82)80011-8] [PMID: 6757973] ]. Further the type of protein may influence the molecular weight pattern of glucagon in plasma. The effect of lipids (free fatty acids) is unclear since both inhibitory and stimulatory effects have been reported under thermo-neutral conditions [47Edwards JC, Howell SL, Taylor KW. Fatty acids as regulators of glucagon secretion. Nature 1969; 224(5221): 808-9.
[http://dx.doi.org/10.1038/224808a0] [PMID: 4902928] , 48Gilon P, Rui C-X. Bao Khanh Lai, Hee-Young Chae, and Ana Gomez-Ruiz Physiological and pathophysiological control of glucagon secretion by pancreatic alpha cells. In: Islets of Langerhans, 2nd ed. 2014, pp 1-73. ].
Under cold stress the negative CEF control and the positive CEBDF control diet induced practically identical plasma glucagon levels. POLYCOSE® and safflower oil significantly decreased while casein significanlty increased the plasma glucagon concentration (Table 4, Fig. 3). The low blood glucose level is a stimulating factor for glucagon secretion. This stimulating effect of low blood glucose level was diminished in the safflower oil fed group. It is generally believed that the insulin/glucagon ratio are regulated in a yin-yang relationship. In our CEF animal model this antagonistic effect is not apparent. The plasma glucagon correlated only with the plasma corticosterone concentration (r=0.890; P=0.043) (Fig. 2) and no correlation was found between the plasma glucagon and plasma insulin or blood glucose concentrations. Our results suggest that glucagon may have role in increaseasing substrate availabilty for gluconeogenesis to assure the carbohydrate refill of liver in stress situations.
3.4.3. I/G Ratio in the Plasma
The I/G ratio (Table 5) was 2.7 in the CEF animals and it was not significantly different from the casein and the safflower oil groups; however casein induced higher (3.8) and the safflower oil fed group showed lower (2.0) I/G ratios. The feeding of POLYCOSE® or CEBDF diets resulted in very high I/G ratio (1028, 634 respectively). According to the correlation analysis the feed intake, the protein and glycogen contents of the liver, the proinsulin mRNA content of the GSP tissue, the glucagon content of the DP tissue and the amylase activity in the small intestinal content significantly correlated with the plasma I/G ratios (Fig. 2). The question as to whether which of these correlations are causal links, with similar signalling modes needs further investigation.
3.4.4. Plasma Pancreatic Polypeptide
The effect of macronutrients on plasma PP concentrations (Table 5 and Fig. 2) were practically opposite to the plasma insulin concentrations. The linear correlation between these two parameters was negative (r =-0.840; p=0.074), and a close polynomial relation between these two parameters (R2=0.990) can be detected (Fig. 5).
This finding is in agreement with the data of Park et al. [49Park HJ, Lee YL, Kwon HY. Effects of pancreatic polypeptide on insulin action in exocrine secretion of isolated rat pancreas. J Physiol 1993; 463: 421-9.
[http://dx.doi.org/10.1113/jphysiol.1993.sp019602] [PMID: 7504106] ], who showed that rat PP completely abolished the potentiating effect of exogenous insulin and glucose on the CCK stimulated flow rate and amylase output of the pancreas. They concluded that insulin is an important stimulatory hormone of pancreatic exocrine secretion, and PP exerts an inhibitory role on it by modulating insulin’s action. Fasting and safflower oil induced higher plasma PP concentration than in the positive control, POLYCOSE® and casein groups (Table 5).
Alphons et al. [50de Jong AJL, Hopman WPM, Jansen JBMJ, Lamers CBHW. Effect of medium-chain triglycerides and long-chain triglycerides on plasma pancreatic polypeptide secretion in man. Regul Pept 1985; 11(1): 77-81.
[http://dx.doi.org/10.1016/0167-0115(85)90033-3] [PMID: 4011957] ] found in human volunteers that the “Ingestion of LCT (long chain triglycerides) resulted in significant increases in plasma PP from 33 ± 7 to 55 ± 7 pmol/l (P < 0.01), whereas both MCT (medium chain triglycerides) and saline did not significantly increase plasma PP concentrations.” They concluded that the secretion of PP in response to triglycerides is dependent on the chain length of the fatty acids. These differences may also be due to the lymphatic transport of long chain fatty acids into the systemic circulation while MCT are transported directly to the liver via the portal vein, thereby undergoing very different metabolic pathways.
Based on these findings, we suggest that PP plays a significant indirect role in the control of blood glucose levels by inhibiting insulin synthesis and/or secretion from the GS pancreas. This assumption is supported by the negative correlations of plasma PP with plasma insulin (r = -0.840; p=0.074) and the insulin content of the GSP tissue (r = -0.940; p=0.015) (Fig. 2).
3.4.5. Plasma Corticosterone
It has been shown that the timing of a meal [51English J, Hampton S, Dunne M, Marks V. The effect of timing of a standard meal on plasma cortisol levels in man. Horm Metab Res 1982; 14(2): 106.
[http://dx.doi.org/10.1055/s-2007-1018939] [PMID: 7200068] ] and the nutrient composition of the meal [52Szabo J, Fodor E, Koranyi L, Bruckner G. Effect of nutrients on plasma corticosteroid concentration in cold-stressed rats. Ann Nutr Metab 1993; 37(2): 53-61.
[http://dx.doi.org/10.1159/000177750] [PMID: 8517634] ] influence plasma corticosteroid concentrations. The physiological mechanism(s) responsible for these alteration is/are not clear. However Szabo and Bruckner [53Szabo J, Bruckner G. ATP potentioal of nutrients may regulate plasma corticosteroid concentration: a hypothesis. J Nutr Biochem 1995; 6: 12-20.
[http://dx.doi.org/10.1016/0955-2863(94)00002-4] ] proposed a hypothesis which suggests that the ”ATP Potential” of nutrients, by influencing the energy metabolism of the cells, is in a negative correlation with the plasma corticosteroid concentration”. The ATP Potential is defined as the net number of moles of ATP generated from a mole of nutrient per the number of TCA cycles used for its metabolism.
When compared to the CEF negative control, safflower oil, POLYCOSE® and the CEBDF positive control diets significantly decreased plasma corticosterone concentration, while casein increased it (Table 5, Fig. 3). The decreased plasma corticosteroid concentration in the POLYCOSE® and safflower oil fed group supports our ATP Potential hypothesis, but the high corticosteroid concentration induced by the casein diet suprisingly did not fit our model. The plasma corticosteron concentration negatively correlated with plasma triglyceride and positively to plasma glucagon and lipase content of DP tissue (Fig. 2).
3.5. Effect of Macronutrients on RNA and Proinsulin-1 mRNA and Hormon Concentrations of Pancreatic Tissues in CE Rats
3.5.1. RNA and Proinsulin-1 mRNA in GSP Tissue
These parameters were determined to study the effect(s) of single macro nutrient on the RNA and proinsulin-1 mRNA contents of the pancreas and to ascertain the relationships among the RNA, proinsulin-1 mRNA, pancreatic hormones (Table 6) and hydrolases (Table 7).
The lowest RNA and proinsulin-1 mRNA concentration was in the pancreas of the fasted animals. The different nutrients increased dramatically the concentrations of these parameters. The difference however between the negative and positive controls was ten to thirty times more (600 to 2962%) than Gidding et al. [54Giddings SJ, Chirgwin J, Permutt MA. The effects of fasting and feeding on preproinsulin messenger RNA in rats. J Clin Invest 1981; 67(4): 952-60.
[http://dx.doi.org/10.1172/JCI110145] [PMID: 6162861] ] reported (66%) in rats housed in a thermoneutral environment. This dramatic difference between the fed and fasted animals and among the different single nutrient fed rats suggests that in the cold exposed fasted animal model the metabolic effects of nutrients are magnified and this model is a useful tool for investigating nutrient metabolomic relationships.
The nutrients induced changes of proinsulin-1 mRNA (Fig. 3) correlated with the amylase in SIC (r=0.940; p=0.015), plasma I/G (r=0.940; p=0.017), liver glucose (r=0.900; p=0.038), glucagon in DP (r=0.900; p=0.036) and negatively with liver protein (r=-0.900; p=0.038) (Fig. 2).
3.5.2. Insulin in DP and GSP Tissues
The data depicted in Table 6, show that there were significant differences in the insulin concentrations of DP (lower + upper duodenal lobes) and GSP (gastric + splenic) lobes of pancreas. This is in concert with the histological structure of the different pancreatic regions reported by Elyat [55Elayat AA, el-Naggar MM, Tahir M. An immunocytochemical and morphometric study of the rat pancreatic islets. J Anat 1995; 186(Pt 3): 629-37.
[PMID: 7559135] ] “the lower and upper duodenal regions were significantly different from the gastric and splenic regions in the mean islet diameter and mean islet volume, whereas no difference was found either between the lower and upper duodenal regions or between gastric and splenic regions”. The same authors also observed that the volume density of B cells in the upper duodenal region were significantly lower than in the lower duodenal, gastric and splenic regions. Further, our data suggest that the insulin concentrations in the two investigated areas of the pancreas do not correlate with each other, indicating that the effect of nutrients, on the synthesis and the secretion of insulin, is not the same in the two-pancreatic regions. The changes of plasma insulin concentration were significantly and positively correlated with the insulin content of GSP tissue (r = 0.880, P=0.048), but not with the insulin contents of the DP lobe (Fig. 2). The relationship between the plasma insulin and DP insulin concentration was negative and was not significant.
In the CEBDF and safflower oil groups the insulin concentration of the DP pancreas (60.54±8.01; 68.55±17.05) was low and not different statistically from each other. The insulin concentrations of DP tissues in the POLYCOSE®, casein and CEF groups were identical and significantly increased compared to the control and safflower groups (99.03±31.94, 90.96±17.59, 94.97±8.20 respectively).
In the GSP lobes the insulin concentrations were similar in the safflower, the casein and the CEF animals; only the CEBDF control and POLYCOSE® diets increased the insulin level above the fasting value (Fig. 3).
3.5.3. Glucagon in DP and GSP Tissues
There was no correlation between the glucagon contents of the two pancreatic sections of rats fed with different diets (Table 6), suggesting that the response of pancreatic alpha cells to the nutrients was different in the two sections. It should be pointed out, that the glucagon content of DP tissue showed significant positive correlations with the parameters of carbohydrate metabolism (plasma I/G, liver glucose and glycogen, proinsulin-1 mRNA and amylase activity in the small intestinal content) whereas the glucagon content of the GSP tissue showed negative correlation with the parameters of lipid and protein digestion (lipase content of DP tissue and trypsinogen contents of DP and GSP tissues) (Fig. 2).
3.5.4. Pancreatic Polypeptide in DP and GSP Tissues
The PP concentrations of the DP tissues were significantly higher than the PP content of GSP tissues (Table 6). This is aligned with the PP producing cell density of the two-pancreatic areas. In both pancreatic lobes the nutrient effect followed the same pattern in the CEF, casein, safflower oil and POLYCOSE® groups but not in the CEBDF group; however, the PP content of DP tissue decreased while PP in the GSP lobe was significantly increased over the CEF group.
In the DP lobes of POLYCOSE®, casein and fasting treatment groups the PP content was significantly higher than in the CEBDF and safflower groups. Contrary to this, the highest PP content was detected in the GSP tissues of the positive CEBDF animals. In both pancreatic lobes the safflower oil induced lower PP concentration.
We did not find correlation between the plasma PP concentration and hydrolase activity in the SIC, suggesting that in this in vivo system plasma PP did not influence the secretion of pancreatic enzymes. The DP PP correlated positively to the insulin content of DP tissue and negatively to the lipase activity in the small intestinal content (Fig. 2). The GSP tissue PP content showed a significant positive correlation with the plasma insulin level and the amylase contents of DP and GSP tissues. Further experiments may shed light on the physiological significance of these correlations.
Among the tested parameters, the feed intake, the energy intake and the body weight changes showed several significant correlations proving that the CEF model is a good tool to study nutrient induced hormonal and metabolic changes and the connections between or among different metabolomic parameters. For example the negative correlation between the plasma PP and feed intake, energy intake and body weight change, as well as between the plasma insulin and PP concentrations, suggests that in the regulation of appetite and body weight, insulin and PP have antagonistic functions. These correlations are in agreement with the finding of Bloom [56Batterham RL, Le Roux CW, Cohen MA, et al. Pancreatic polypeptide reduces appetite and food intake in humans. J Clin Endocrinol Metab 2003; 88(8): 3989-92.
[http://dx.doi.org/10.1210/jc.2003-030630] [PMID: 12915697] ], who demonstrated that PP reduces appetite and food intake in humans.
3.6. Effect of nutrients and Fasting on Hydrolase Activity in the Pancreatic Tissue and Small Intestinal Content
3.6.1. Amylase in DP and GSP Tissues
We hypothesized that pancreatic hormones (especially insulin) control the synthesis of pancreatic hydrolases (especially amylase). This hypothesis was based on the facts that in streptozotocin diabetic animals the amylase contents of the pancreatic tissue and activity in the small intestinal content were significantly lower than it was in the control or insulin supplemented diabetic rats [57Szabó J, Fodor E, Vetési F, Tenk I. Pancreatic and small-intestinal digestive enzyme activities in rats with streptozotocin-diabetes. Acta Vet Acad Sci Hung 1981; 29(4): 451-69.
[PMID: 7053017] ].
Because the size, the frequency and the distribution of Langerhans islands and also the hormone producing cells in the DP and GSP tissues are significantly different, we also hypothesized that the digestive enzyme concentrations in the two pancreatic lobes would also be significantly different. We also speculated that the hydrolase activity in SIC would correlate with the hydrolase contents of the pancreatic tissues.
Contrary to our hypothesis, we did not find significant difference between the amylase contents of the two-pancreatic lobes, however the amylase level was always lower in DP than GSP tissues. The nutrient induced changes (Table 7 and Fig. 3) showed identical tendencies in both lobes suggesting that the nutrient related control mechanism(s) of amylase synthesis in the DP and GSP tissues is/are identical and not influenced significantly by the different beta cell density in the two pancreatic areas. The amylase content of GSP tissue showed significant correlations with the PP content of GSP tissues (Fig. 2).
The second important finding is that the amylase activity in the small intestinal content did not follow the nutrient induced changes of amylase content of the pancreatic tissues, showing that the secretion of amylase is under different control mechanism(s) than the enzyme synthesis in the pancreas. The stimulatory effect of POLYCOSE® on amylase secretion (activity in the small intestinal content) was clearly apparent (Table 7).
Compared to the CEF control the casein and the safflower oil diet significantly decreased the amylase content of tissue homogenates in the DP lobe and only the CEBDF diet increased it significantly, however the amylase content of the two-pancreatic lobes was similar.
Only rats on the safflower oil diet showed significant decreases in amylase activity. It was surprising that the POLYCOSE® diet did not induce significant changes relative to the CEF control. Compared to the CEF group, the amylase activity in SIC did not change significantly in the casein and safflower groups; only the CEBDF and POLYCOSE® diets increased the amylase activity significantly (Table 7).
The correlation analysis (Fig. 2) showed that the blood glucose, the plasma insulin, the GSP PP, the DP amylase and the GSP lipase were in a significant linear relationship with the amylase content of GSP tissue.
On the basis of these data, we conclude, that the amylase content of the exocrine pancreatic tissue and amylase activity in the small intestinal content are influenced differently and most likely by differing mechanisms depending on the macronutrients fed.
3.6.2. Lipase in DP and GSP Tissues
However there are certain tendencies in the effects of macronutrients on the lipase contents of the DP and GSP tissues (Table 7) there is no statistically proven relationship between them.
As noted there were significant differences between the lipase contents of the two lobes in the CEF, the CEBDF, POLYCOSE® and safflower oil diets; the difference in the casein group was not significant.
The lipase content of DP tissues negatively correlated with the plasma triglyceride (r = -0.990; p=0.0007) and glucagon in GSP tissue (r = -0.893; p=0.041), while a positive correlations was detected regarding plasma corticosterone (r = 0.917; p=0.028) (Fig. 2).
3.6.3. Trypsin in DP and GSP Tissues
The highest trypsinogen content was in the casein fed and CEF rats in both pancreatic lobes. Significantly lower trypsinogen concentrations were noted in the CEBDF and POLYCOSE® fed animals; however the lowest trypsinogen concentration was detected in both lobes of the safflower oil fed rats (Table 7).
The trypsinogen content was significantly different between the two-pancreatic regions in CEBDF, POLYCOSE®, safflower oil fed and fasted rats but not in rats on casein diet. The nutrient induced changes (Table 7, Fig. 3) followed the same pattern in both pancreatic lobes (r = 0.982; p=0.003).
The trypsin activity in the small intestinal contents did not correlate with the trypsinogen values of the two pancreatic lobes showing that the synthesis and the secretion of digestive enzymes are under different control mechanisms, as also noted for amylase and lipase.
In both pancreatic lobes the trypsinogen content correlated with liver triglyceride, liver FFA, glucagon in GSP tissue, lipase in DP tissue and trypsinogen in GSP tissue. The trypsin activity in SIC correlated with the blood glucose level of the rats (Fig. 2). More study is needed to understand the real significance of these correlations.
CONCLUSION
As we hypothesized on the basis of the histological findings of DP and GSP tissues, the two pancreatic lobes had significant hormonal concentration differences similar to the histological observations.
Contrary to our hypothesis, with regards to the hydrolase content in the DP and GSP lobes, we see three different patterns emerge in response to nutrients.
The amylase enzyme concentrations of the two pancreatic lobes were almost identical and the nutrient induced changes were also similar (correlation between the amylase contents of DP and GSP tissues was significant statistically (r=0.971; p<0.01).
The lipase contents of DP and GSP tissues were significantly different and there was no correlation between the lipase contents of the two-pancreatic areas, suggesting that the rate of lipase synthesis is different in the DP and GSP tissues.
Trypsin, also showed significant difference in the enzyme contents of DP and GSP tissues, but the nutrient induced changes in both pancreatic lobes were similar (r=0.982; p<0.01), suggesting that the nutrient related control mechanism for trypsin synthesis may be the same but the intensity of trypsinogen synthesis in the two lobes of the pancreas are different.
The CEF animal model, in which catabolism is markedly elevated compared to animals CEBDF is a good tool for elucidating the effects of macronutrients on metabolomic pathways and metabolomic parameters associated with the endocrine and exocrine pancreatic function(s).
Using the centrality analysis (hierarchical analysis followed by weights of nodes) it is clear that the functional relationship(s) between the endocrine and exocrine pancreatic functions and among the investigated metabolomic parameters are much more complex than we hypothesized. It is evident that feed intake, liver glucose, small intestinal amylase hold a high position in metabolomics network (Fig. 2). The correlation analysis revealed several important and interesting relationships for further investigations. This approach should prove to be useful regarding nutritional optimization for animals in CE conditions.
HUMAN AND ANIMAL RIGHTS
Humans did not participate in this research. All animal research procedures followed were in accordance with the standards set forth in the 8th Edition of Guide for the Care and Use of Laboratory Animals (http://grants.nih.gov/grants/olaw/Guide-for-the-care-and-use-of-laboratory-animals.pdf) published by the National Academy of Sciences, The National Academies Press, Washington DC, United States of America.
CONSENT FOR PUBLICATION
Not applicable.
CONFLICT OF INTEREST
The authors declare no conflict of interest, financial or otherwise.
ACKNOWLEDGMENTS
We want to thank Ms. Curley B. Horton for her assistance with the insulin and PP analysis.
REFERENCES
| [1] | Szabo J, Fodor E, Korányi L, Bruckner G. Effect of nutrients on plasma corticosteroid concentration in cold-stressed rats. Ann Nutr Metab 1993; 37(2): 53-61. [http://dx.doi.org/10.1159/000177750] [PMID: 8517634] |
| [2] | Henderson JR. Why are the islets of Langerhans? Lancet 1969; 2(7618): 469-70. [http://dx.doi.org/10.1016/S0140-6736(69)90171-8] [PMID: 4183910] |
| [3] | Bonner-Weir S. The microcirculature of the pancreas, with emphasis on that of islets of Langerhans. Anatomy and functional implications.The Pancreas: Biology, Pathobiology, and Disease 2nd ed. 1993; 759-68. |
| [4] | Elayat A A, El-naggar M M, Tahir M. An immunocytochemical and morphometric study of the rat pancreatic islets. 1995; 186: 629-37. |
| [5] | Grossman MI, Greengard H, Ivy AC. The effect of dietary composition on pancreatic enzymes. Am J Physiol 1942-43; 138: 672-82. |
| [6] | Hong SS, Magee DF. Influence of dietary amino acids on pancreatic enzymes. Am J Physiol 1957; 191(1): 71-4. [http://dx.doi.org/10.1152/ajplegacy.1957.191.1.71] [PMID: 13478687] |
| [7] | Szabó J, Ribiczey P, Fodor E, Tenk I. Influence of environmental factors on digestive enzymes and plasma corticosterone in rats. I. Diet. Acta Vet Acad Sci Hung 1981; 29(4): 399-422. [PMID: 7053015] |
| [8] | Szabó J, Ribiczey P, Fodor E, Tenk I. Influence of environmental factors on digestive enzymes and plasma corticosterone in rats. II. Ambient temperature. Acta Vet Acad Sci Hung 1981; 29(4): 423-35. [PMID: 7053016] |
| [9] | Szabó J, Ribiczey P, Fodor É, Tenk I. Influence of environmental factors on digestive enzymes and plasma corticosterone in rats. III. Atmospheric pressure. Acta Vet Acad Sci Hung 1981; 29: 437-40. [PMID: 6764086] |
| [10] | Trinder P. Determination of blood glucose using an oxidase-peroxidase system with a non-carcinogenic chromogen. J Clin Pathol 1969; 22(2): 158-61. [http://dx.doi.org/10.1136/jcp.22.2.158] [PMID: 5776547] |
| [11] | Biggs HG, Erikson JM, Moorehead WR. A manual colormetric assay of triglycerides in serum. Clin Chem 1975; 21(3): 437-41. [PMID: 1112059] |
| [12] | Duncombe WG. The colorimetric micro-determination of long-chain fatty acids. Biochem J 1963; 88(1): 7-10. [http://dx.doi.org/10.1042/bj0880007] [PMID: 16749030] |
| [13] | Murphy BEP. Some studies of the protein-binding of steroids and their application to the routine micro and ultramicro measurement of various steroids in body fluids by competitive protein-binding radioassay. J Clin Endocrinol Metab 1967; 27(7): 973-90. [http://dx.doi.org/10.1210/jcem-27-7-973] [PMID: 4291524] |
| [14] | Lowry OH, Rosebrough NJ, Farr AL, Randall RJ. Protein measurement with the Folin phenol reagent. J Biol Chem 1951; 193(1): 265-75. [PMID: 14907713] |
| [15] | Good CA, Kramer H, Somogyi M. The determination of glycogen. J Biol Chem 1933; 100: 485-91. |
| [16] | Trinder P. Determination of blood glucose using an oxidase-peroxidase system with a non-carcinogenic chromogen. J Clin Pathol 1969; 22(2): 158-61. [http://dx.doi.org/10.1136/jcp.22.2.158] [PMID: 5776547] |
| [17] | Sambrook J, Frittsch EF, Maniatis T. Molecular Cloning. Laboratory Manual. Cold Spring Harbor Laboratory, 1989 New York |
| [18] | Tom W. Gettys, Richard Garcia, Karin Savage, David C. Whitcomb, Shuji Kanayama, and Ian L. Taylor insulin-sparing effects of pancreatic polypeptide in congenitally obese rodents. PancreasVol 1991; 6(1): 46-53. [http://dx.doi.org/10.1097/00006676-199101000-00007] |
| [19] | Phedebas Amylase Tests, Pharmacea Diagnostics AB, Upsala, Sweden |
| [20] | Schön H, Rassler B, Henning N. Über die untersuchung der exretorischen pancreasfunction. Methoden zur activatsbestimmung von Trypsin, chymotrypsin, carboxipeptidase, lipase und diastase. Klin Wochenschr 1961; 39: 217-22. [PMID: 13748352] |
| [21] | Szabó J, Ribiczey P, Fodor E, Tenk I. Influence of environmental factors on digestive enzymes and plasma corticosterone in rats. I. Diet. Acta Vet Acad Sci Hung 1981; 29(4): 399-422. [PMID: 7053015] |
| [22] | IBM SPSS Statistics version 18.0 (IBM SPSS Statistics, IBM Corporation, Armonk, New York). https:// www.calstatela.edu/ sites/default/ files/groups/ Information%20Technology% 20Services/training/ pdf/spss23p3.pdf |
| [23] | Myles Hollander & Douglas A. Wolfe. Nonparametric Statistical Methods 1973. |
| [24] | The R Project for Statistical Computing (R Core Team (2016). R: A language and environment for statistical computing. R Foundation for Statistical Computing, Vienna, Austria. URL https://www.R-project.org |
| [25] | yEd Graph Editor https://www.yworks.com/products/yed |
| [26] | Kolde R. 2018. pheatmap: Pretty Heatmaps. R package version 1.0.10. https:// CRAN.R-project.org/ package=pheatmap |
| [27] | Alhaidary A, Mohamed HE, Beynen AC. Differences between rats and rabits in their response of feed and energy intake to increasing dietary fat content. Scand J Lab Anim Sci 2010; 37: 237-40. |
| [28] | Coll AP, Farooqi IS, O’Rahilly S. The hormonal control of food intake. Cell 2007; 129(2): 251-62. [http://dx.doi.org/10.1016/j.cell.2007.04.001] [PMID: 17448988] |
| [29] | Mercer P L, Watson D F, Ramlet J S. Control of food intake in the rat by dietary protein concentration. J Nutr 1981; 111: 1117-23. |
| [30] | Greenman Y, Golani N, Gilad S, Yaron M, Limor R, Stern N. Ghrelin secretion is modulated in a nutrient- and gender-specific manner. Clin Endocrinol (Oxf) 2004; 60(3): 382-8. [http://dx.doi.org/10.1111/j.1365-2265.2004.01993.x] [PMID: 15009005] |
| [31] | Wang, Yang Y, Xiang X, Zhu Y, Men J, He M. Estimation of the normal range of blood glucose in rats. 2010. Wei Sheng Yan Jiu. 2010; 39(2):133-7, 142. [Article in Chinese] |
| [32] | Byers SO, Friedman M. Site of origin of plasma triglyceride. Am J Physiol 1960; 198: 629-31. [http://dx.doi.org/10.1152/ajplegacy.1960.198.3.629] [PMID: 13806614] |
| [33] | Ettinger WH, Klinefelter HF, Kwiterovitch PO. Effect of short-term, low-dose corticosteroids on plasma lipoprotein lipids. Atherosclerosis 1987; 63(2-3): 167-72. [http://dx.doi.org/10.1016/0021-9150(87)90117-1] [PMID: 3493784] |
| [34] | Gordon RS Jr. Unesterified fatty acid in human blood plasma. II. The transport function of unesterified fatty acid. J Clin Invest 1957; 36(6 Part 1): 810-5. [http://dx.doi.org/10.1172/JCI103486] [PMID: 13439020] |
| [35] | Roden M, Price TB, Perseghin G, et al. Mechanism of free fatty acid-induced insulin resistance in humans. J Clin Invest 1996; 97(12): 2859-65. [http://dx.doi.org/10.1172/JCI118742] [PMID: 8675698] |
| [36] | Chait A, Brunzell JD, Johnson DG, et al. Reduction of plasma triglyceride concentration by acute stress in man. Metabolism 1979; 28(5): 553-61. [http://dx.doi.org/10.1016/0026-0495(79)90197-5] [PMID: 221783] |
| [37] | Delgado TC, Pinheiro D, Caldeira M, et al. Sources of hepatic triglyceride accumulation during high-fat feeding in the healthy rat. NMR Biomed 2009; 22(3): 310-7. [http://dx.doi.org/10.1002/nbm.1327] [PMID: 19012281] |
| [38] | Neschen S, Moore I, Regittnig W, et al. Contrasting effects of fish oil and safflower oil on hepatic peroxisomal and tissue lipid content. Am J Physiol Endocrinol Metab 2002; 282(2): E395-401. [http://dx.doi.org/10.1152/ajpendo.00414.2001] [PMID: 11788372] |
| [39] | Pfeuffer M, Barth CA. Modulation of very low-density lipoprotein secretion by dietary protein is age-dependent in rats. Ann Nutr Metab 1986; 30(5): 281-8. [http://dx.doi.org/10.1159/000177205] [PMID: 3752927] |
| [40] | Mashek DG. Hepatic fatty acid trafficking: multiple forks in the road. Adv Nutr 2013; 4(6): 697-710. [http://dx.doi.org/10.3945/an.113.004648] [PMID: 24228201] |
| [41] | Gerich JE, Charles MA, Grodsky GM. Characterization of the effects of arginine and glucose on glucagon and insulin release from the perfused rat pancreas. J Clin Invest 1974; 54(4): 833-41. [http://dx.doi.org/10.1172/JCI107823] [PMID: 4430717] |
| [42] | Gerich JE, Charles MA, Grodsky GM. Characterization of the effects of arginine and glucose on glucagon and insulin release from the perfused rat pancreas. J Clin Invest 1974; 54(4): 833-41. [http://dx.doi.org/10.1172/JCI107823] [PMID: 4430717] |
| [43] | Kashyap S, Belfort R, Gastaldelli A, et al. A sustained increase in plasma free fatty acids impairs insulin secretion in nondiabetic subjects genetically predisposed to develop type 2 diabetes. Diabetes 2003; 52(10): 2461-74. [http://dx.doi.org/10.2337/diabetes.52.10.2461] [PMID: 14514628] |
| [44] | Unger RH, Eisentraut AM, McCall MS, Keller S, Lanz HC, Madison LL. Glucagon antibodies and their use for immunoassay for glucagon. Proc Soc Exp Biol Med 1959; 102(10): 621-3. 3 [http://dx.doi.org/10.3181/00379727-102-25338] |
| [45] | Vieira E, Salehi A, Gylfe E. Glucose inhibits glucagon secretion by a direct effect on mouse pancreatic alpha cells. Diabetologia 2007; 50(2): 370-9. [http://dx.doi.org/10.1007/s00125-006-0511-1] [PMID: 17136393] |
| [46] | Noseda G, Fragiacomo C, Gatti E, Descovich G, Sirtori CR. Glucagon release following experimental diets in man: effects of soybean and casein enriched diets. Pharmacol Res Commun 1982; 14(9): 867-78. [http://dx.doi.org/10.1016/S0031-6989(82)80011-8] [PMID: 6757973] |
| [47] | Edwards JC, Howell SL, Taylor KW. Fatty acids as regulators of glucagon secretion. Nature 1969; 224(5221): 808-9. [http://dx.doi.org/10.1038/224808a0] [PMID: 4902928] |
| [48] | Gilon P, Rui C-X. Bao Khanh Lai, Hee-Young Chae, and Ana Gomez-Ruiz Physiological and pathophysiological control of glucagon secretion by pancreatic alpha cells. In: Islets of Langerhans, 2nd ed. 2014, pp 1-73. |
| [49] | Park HJ, Lee YL, Kwon HY. Effects of pancreatic polypeptide on insulin action in exocrine secretion of isolated rat pancreas. J Physiol 1993; 463: 421-9. [http://dx.doi.org/10.1113/jphysiol.1993.sp019602] [PMID: 7504106] |
| [50] | de Jong AJL, Hopman WPM, Jansen JBMJ, Lamers CBHW. Effect of medium-chain triglycerides and long-chain triglycerides on plasma pancreatic polypeptide secretion in man. Regul Pept 1985; 11(1): 77-81. [http://dx.doi.org/10.1016/0167-0115(85)90033-3] [PMID: 4011957] |
| [51] | English J, Hampton S, Dunne M, Marks V. The effect of timing of a standard meal on plasma cortisol levels in man. Horm Metab Res 1982; 14(2): 106. [http://dx.doi.org/10.1055/s-2007-1018939] [PMID: 7200068] |
| [52] | Szabo J, Fodor E, Koranyi L, Bruckner G. Effect of nutrients on plasma corticosteroid concentration in cold-stressed rats. Ann Nutr Metab 1993; 37(2): 53-61. [http://dx.doi.org/10.1159/000177750] [PMID: 8517634] |
| [53] | Szabo J, Bruckner G. ATP potentioal of nutrients may regulate plasma corticosteroid concentration: a hypothesis. J Nutr Biochem 1995; 6: 12-20. [http://dx.doi.org/10.1016/0955-2863(94)00002-4] |
| [54] | Giddings SJ, Chirgwin J, Permutt MA. The effects of fasting and feeding on preproinsulin messenger RNA in rats. J Clin Invest 1981; 67(4): 952-60. [http://dx.doi.org/10.1172/JCI110145] [PMID: 6162861] |
| [55] | Elayat AA, el-Naggar MM, Tahir M. An immunocytochemical and morphometric study of the rat pancreatic islets. J Anat 1995; 186(Pt 3): 629-37. [PMID: 7559135] |
| [56] | Batterham RL, Le Roux CW, Cohen MA, et al. Pancreatic polypeptide reduces appetite and food intake in humans. J Clin Endocrinol Metab 2003; 88(8): 3989-92. [http://dx.doi.org/10.1210/jc.2003-030630] [PMID: 12915697] |
| [57] | Szabó J, Fodor E, Vetési F, Tenk I. Pancreatic and small-intestinal digestive enzyme activities in rats with streptozotocin-diabetes. Acta Vet Acad Sci Hung 1981; 29(4): 451-69. [PMID: 7053017] |
Endorsements
Browse Contents
Table of Contents
- INTRODUCTION
- MATERIALS AND METHODS
- RESULTS AND DISCUSSION
- ETHICS APPROVAL AND CONSENT TO PARTICIPATE
- HUMAN AND ANIMAL RIGHTS