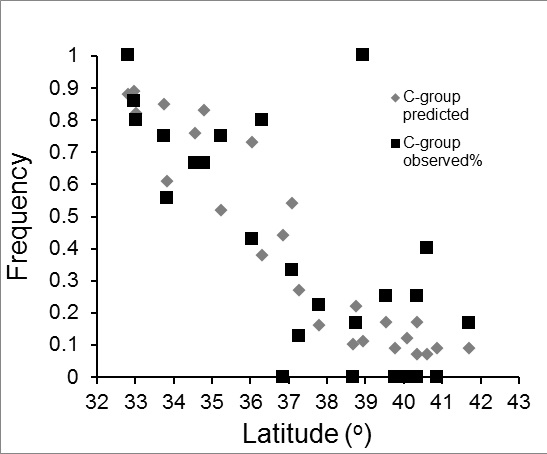
Fig. (1)
Plot of C-group haplotypes that were adjusted by Paxton et al. [26] using a function of latitude and elevation, and raw values (C-group observed). With the exception of one outlier, the two plots suggest no step-cline between E. t. adastus and E. t. extimus.