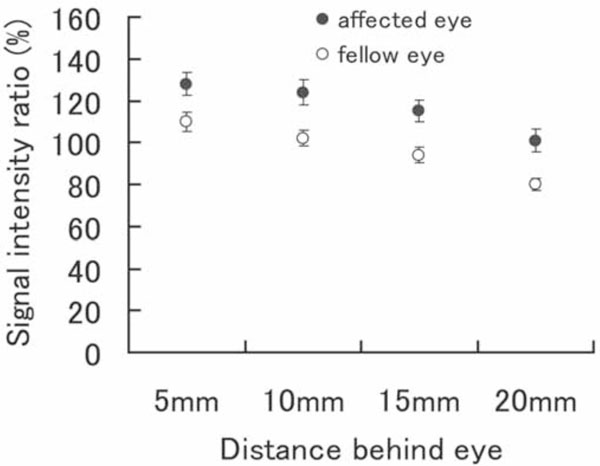
Fig. (3)
Means ± SE of the values from the 4 slices behind the eye are shown. In all parts, the ratio was significantly higher in affected eyes.