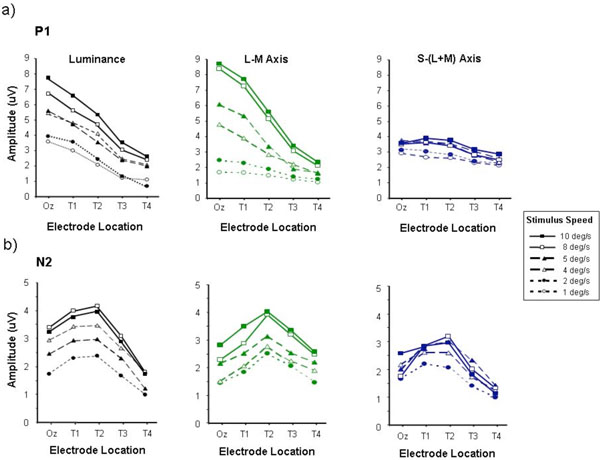
Fig. (2) P1 (a) and N2 (b) amplitudes measured from motion-onset VEPs elicited by luminance, L-M and S/(L+M) chromatic stimuli, plotted as a function of electrode placement. This graph, like all the following, represents averages taken from 6 observers. Data are shown for high contrast stimuli of speeds ranging from 1 - 10 deg/sec. Average standard error approximated to twice the size of the data points.