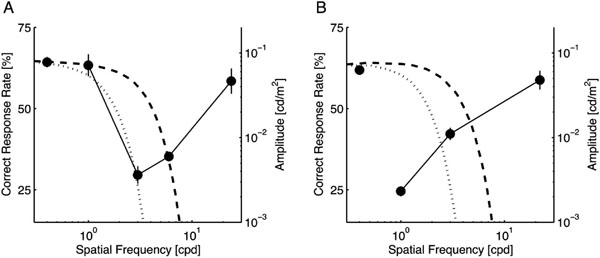
Fig. (3) Correct response rates of notch-filtered targets. Each data point was plotted at the center frequency of the applied notch filter except for the leftmost point, which represents the performance level without notch filtering. Error bars show the standard error. For the small target (A), the signal band ranged from approximately 2 to 8 cpd. For the large target (B), it shifted to lower spatial frequencies (less than 4 cpd). In each panel, the amplitude spectra of surrounding stimuli used in Experiment 1 were superimposed (refer to the right ordinate). Dashed and dotted curves respectively represent the σs-noise and σl-noise.