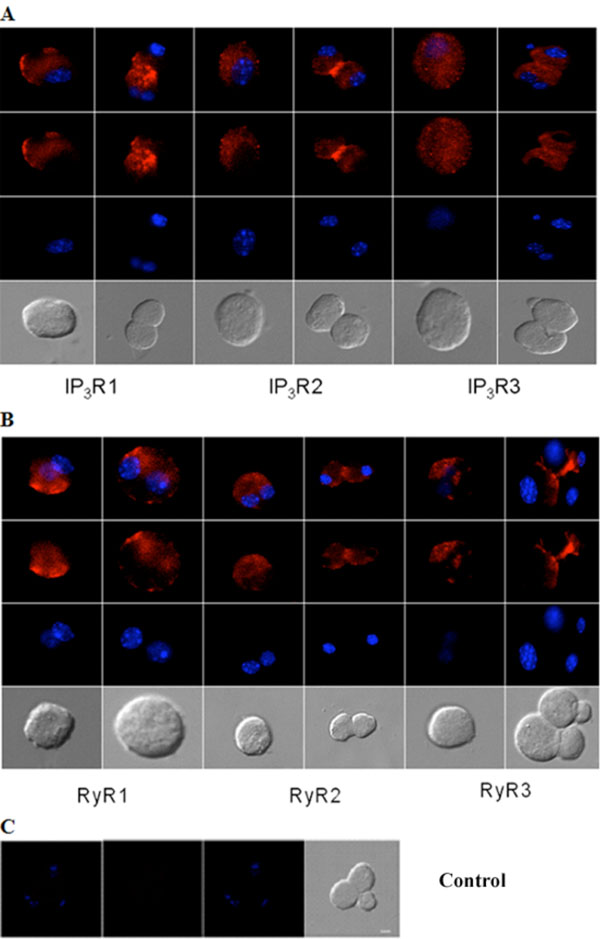
Fig. (3) Immunocytochemical analysis of IP3Rs and RyRs distribution in acutely isolated acinar cells of the adult mouse lacrimal gland. Representative images of (A) IP3R1, IP3R2, IP3R3 and (B) RyR1, RyR2 and RyR3. (C) Omission of primary antibody yielded the negative control. Red (Alexa Fluor® 594 labeled immunoreactivity) shows receptor signals and the nuclear counterstain (DAPI) is displayed in blue. Scale bar in C for A-C, 10 µm.