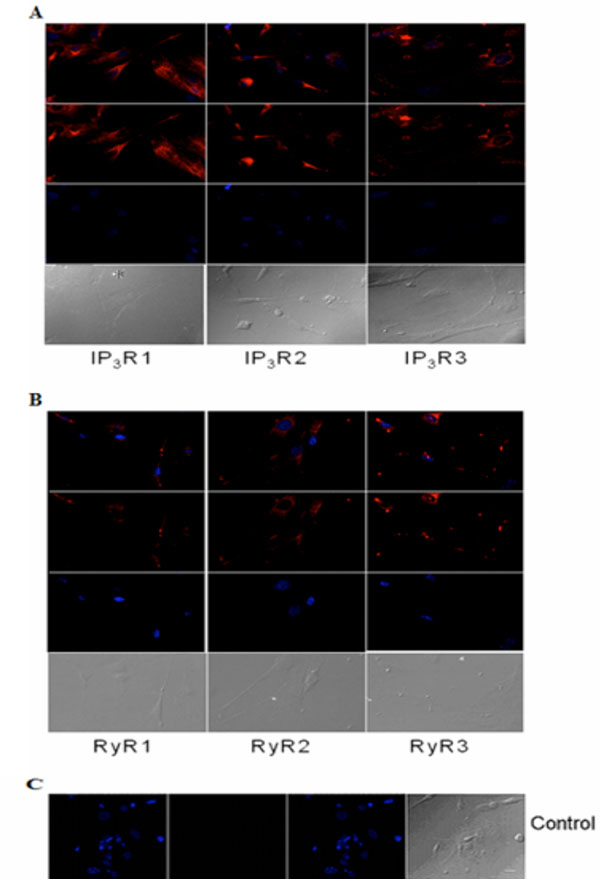
Fig. (4) Immunocytochemical analysis of IP3Rs and RyRs distribution in cultured acinar cells of the P10 lacrimal gland after 10 DIV. Representative images of (A) IP3R1, IP3R2, IP3R3 and (B) RyR1, RyR2 and RyR3 are shown. (C) Primary antibody was omitted for the negative control. Red (Alexa Fluor® 594 labeled immunoreactivity) shows receptor signals and the nuclear counterstain (DAPI) is displayed in blue. Scale bar in C for A-C, 10 µm.