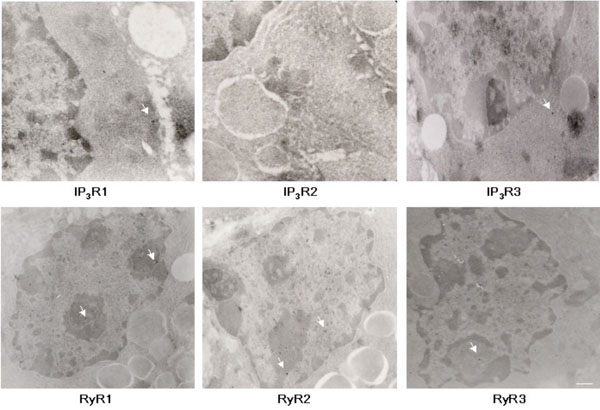
Fig. (5) EM analysis of IP3R and RyR immunoreactivity in adult lacrimal gland sections. Representative images of IP3R1, IP3R2, IP3R3, RyR1, RyR2, RyR3 staining. Arrows indicate 15 nm immunogold label in different subcellular compartments. Scale bar, 100nm (RyR1, RyR2, RyR3, IP3R3, and 160nm (IP3R1 and IP3R2).