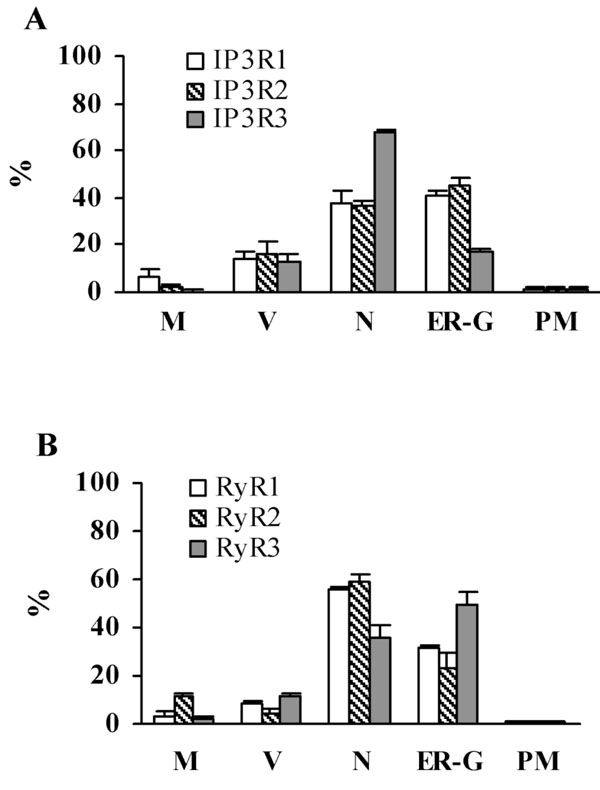
Fig. (6) EM semi-quantitative analysis of ultrastructural immunoreactivity in adult mouse lacrimal gland tissue. Graph A shows immunoreactivity for IP3R1, 2, and 3 and graph B; for RyR1, 2, and 3. Immunoreactivity in Mitochondria (M), Vesicles (V), Nucleus (N) ER-Golgi Apparatus (ER-G), and Plasma Membrane (PM) displayed along x axis. Percentage of total particles (minus controls) indicated along Y axis. The subcellular regions most highly associated with IP3R1 and 2 immunoreactivity are the nucleus, ER and Golgi apparatus, while the nuclear structures are more highly associated with IP3R3. Analysis shows RyR1 and 2 to be more highly expressed in nuclear structures and ER-Golgi apparatus, while RyR3 is expressed in ER-Golgi with less immunoreactivity in the nucleus.