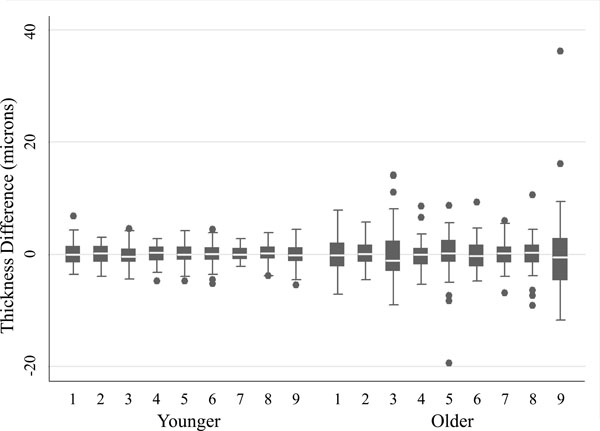
Fig. (2) Box and whisper plots for older and younger groups at each of the 9 EDTRS (Fig. 1) sectors. To establish variability across the 10 scans obtained for each participant (Fig. 2) the mean of the OCT measures was determined for each participant at each of the 9 retinal EDTRS sectors (Fig. 1). Then, for each sector, the difference between the mean thickness for that participant and the thickness obtained in their first, second, third etc. scans was determined. Hence, for each box in the plot above a total of 60 differences have been calculated (i.e. based upon 6 participants x 10 scans each). The middle horizontal bar in the box indicates the median difference, and the top and bottom horizontal boundaries of the box represents the third and first quartiles. The top and bottom bars represent the maximum and minimum differences in the absence of outliers. Single scans which are outliers are represented by dots.