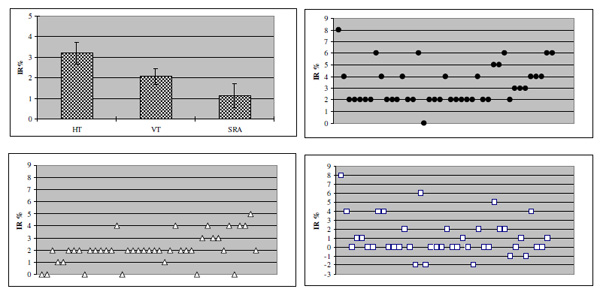
Fig. (2) Recognition thresholds for elliptical patterns as found in the sample of normal subjects and distribution of individual thresholds. Top
left: mean HT, VT and SRA (confidence interval: 95%). Top right and bottom: distribution of individual HT (filled circles), VT (triangles)
and SRA (squares); X- axes represent individual data.