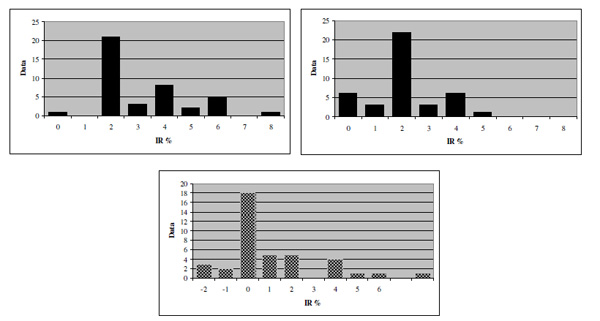
Fig. (3)
Frequency distributions of HT (top left), VT (top right) and SRA (bottom).