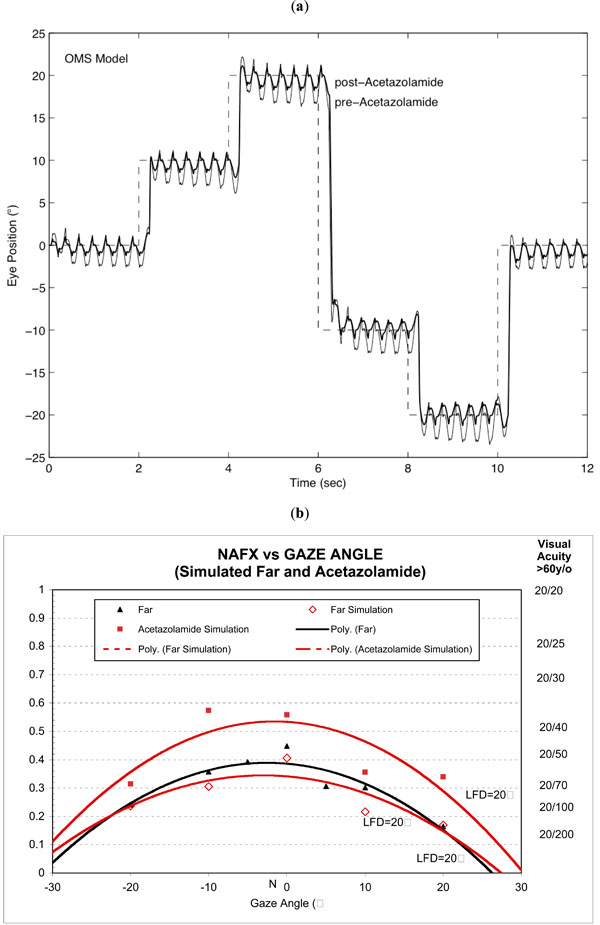
Fig. (6) (a) Plots of OMS model outputs simulating far fixation at 0°, ±10°, and ±20° for both the pre- and post-acetazolamide (heavy line)
conditions. (b) Plots of NAFX vs Gaze Angle for the simulated data in (a). Shown for comparison is the Far curve from the subject’s data.